The 60-40 stock & bond allocation is widely considered the classic diversification play to help buffer portfolios during periods of market stress. The 60-40 portfolio, which consists of 60% equities and 40% fixed income, is really an approximation of the optimal amount of risk people are generally willing to take. Historically, stocks have generally risen over time, and when they fall investors typically seek safety — which is to say, they buy bonds. A portfolio that allocates to both, then, can help investors manage volatility. However, the 60-40 portfolio doesn’t always work as advertised.
The Origin of the 60-40 Portfolio

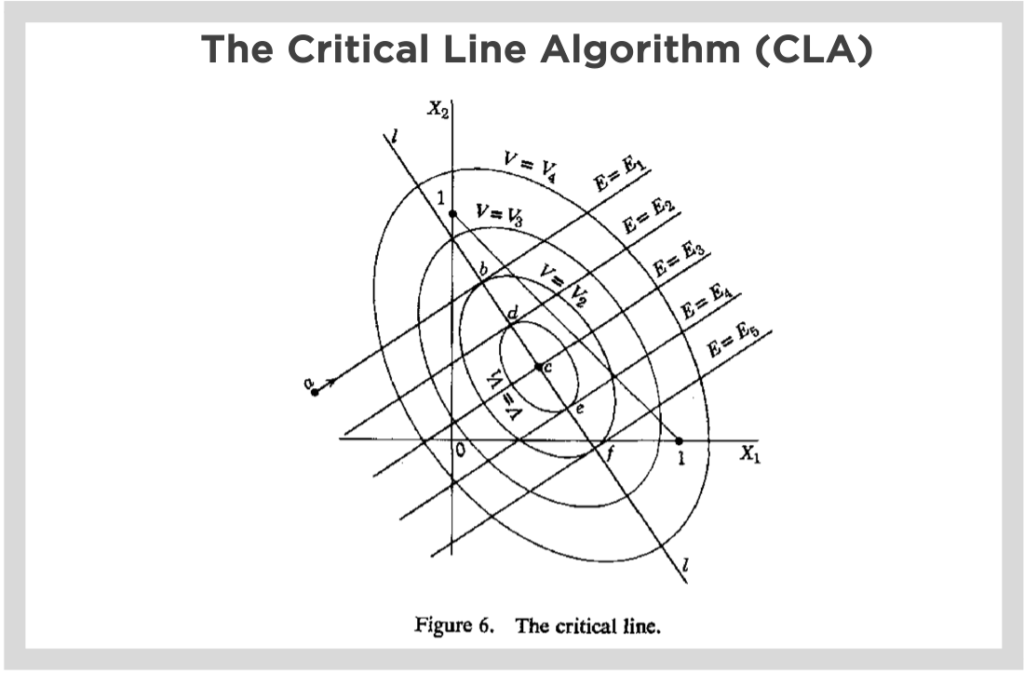
The 60-40 portfolio was developed during 1950s, before Sputnik or manned space flight (literally or figuratively) took off. This is when Harry Markowitz did his pioneering work in operations research, founding modern portfolio theory and creating a framework to calculate the optimal risk-reward trade-off. Part of his contribution was the critical line algorithm, which helped solve for the optimal portfolio. This contribution was especially helpful in the days before computers were readily accessible – it was difficult to compute pretty much anything, as you had to do everything by hand. This was even true of NASA, where in the Mercury space program that ran until 1963 they (now famously) used human computers to calculate the space capsule’s optimal reentry trajectory.
The Critical Line Algorithm (CLA) lets you do something that would take a lot more computational cycles in a really condensed manner to find the optimal set of securities in a portfolio. About a decade later, William Sharpe came along and developed something called the Capital Asset Pricing Model, or CAPM, which is a set of assumptions around risk and reward that applies to investors globally. The CAPM quickly emerged as a helpful tool to build a portfolios and manage risk.
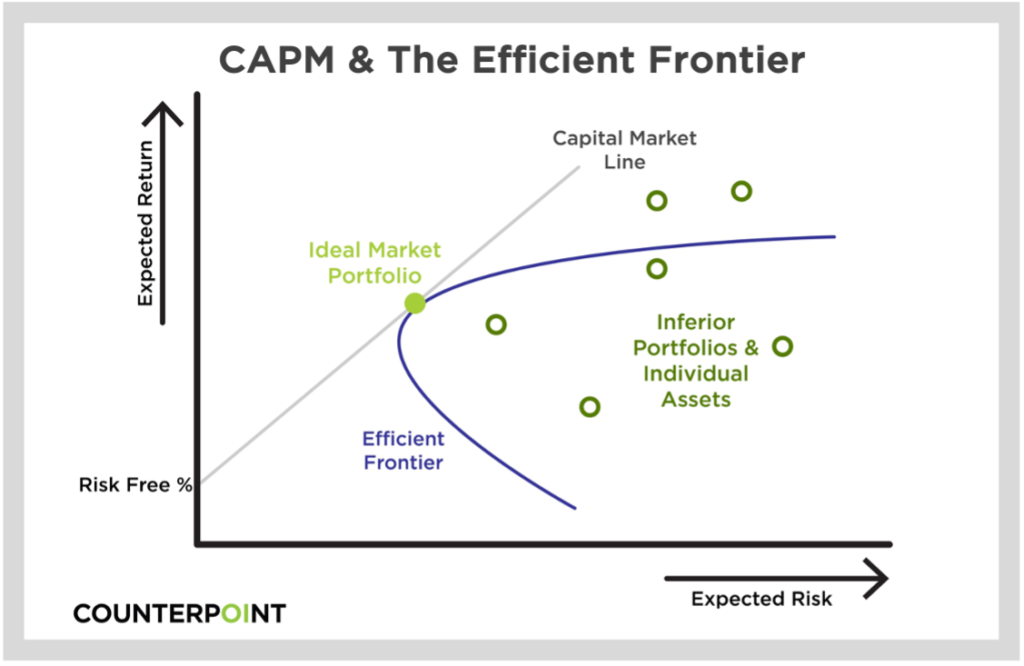
Modern Portfolio Theory (MPT) suggests that starting with the risk-free rate, the expected return of a portfolio increases as the risk increases. A portfolio that fits on the Capital Market Line (CML) is better than any possible portfolio to the right of that line, but, at some point, a theoretical portfolio can be constructed on the CML that intersects with the Efficient Frontier curve to offer the best return for the amount of risk being taken. This risk/return trade-off is called a Sharpe Ratio. This tangency portfolio has the highest possible Sharpe Ratio and, under the assumptions of the CAPM, is the “market” for all investible assets (and that doesn’t just include stocks.)
Another way to think about the market portfolio is this: Imagine a theoretical portfolio composed roughly of all the securities you could possibly hold globally in the exact same ratio as those securities are to the entire market. For example – if California government bonds make up 1% of all existing assets globally, you would have no more than 1% of your portfolio invested in that position. (The same way market indexes are composed today.) This was Sharpe’s contribution to help investors find efficient portfolios, but it leaves open the question: what’s the right portfolio for an individual to hold, given their risk preference?
Critics like to poke holes in MPT and CAPM, as these models implicitly assume the market is efficient and can’t be beat. While we do agree these models have a weakness – that weakness being that your output as only as good as your inputs (which are the covariance matrix and expected returns) – we don’t think that justifies dismissing the value of this pioneering work. It is hard to dispute that the machinery offered to the investment public is robust and undeniably innovative, as long as you get the inputs right.
Training Models with Old Data
Markowitz and Sharpe’s pioneering work helped spur massive progress in formalizing the investment process, turning something that had been more akin to gambling into a rigorous process that still informs how many investors build their net worth today. However, a word of caution for investors: there is often a little detachment when looking at long-term data, especially as an observer can’t always put themselves in the shoes of an investor who experienced the ups and downs of a long distant past.
Markets weren’t as investible back then as they are today. For instance: how would one hold a bond portfolio?

Well, an investor could construct a portfolio, potentially requiring them to hold some paper notes, but maybe that investor didn’t have an observable market that they can actively track. And who knows? They might not have even noticed. They might have been more worried about the lights being on the next day; a civil war, two world wars, not to mention it was a relatively new invention for a lot of that period in time after all!
It’s an important reminder that when looking at data, investors need to appreciate how markets have changed over time. Relying solely on historical insights has limited value, especially in fast-changing businesses where consumer behavior and preferences, as well as market conditions, are constantly evolving. Historical insights are based on past trends and events, which may not apply to current or future market environments and can lead to underperformance.
The 60-40 Portfolio & Correlation Risk

The key assumption behind the 60-40 portfolio, and why it is still seen as the classic diversification play, is the underlying assumption about correlation between its two core asset classes: stocks and bonds. The theory goes: if stocks and bonds are historically less correlated to one another, and tend to be inversely correlated (or effectively function as a hedge) during periods of market stress, then a portfolio only needs to be composed of these traditional asset classes to buffer against periods of uncertainty along with the use of strategic diversification to help limit sources of systemic risk, right? The answer is, not quite…
Loss From Peak S&P 500 vs. 60-40 Portfolio
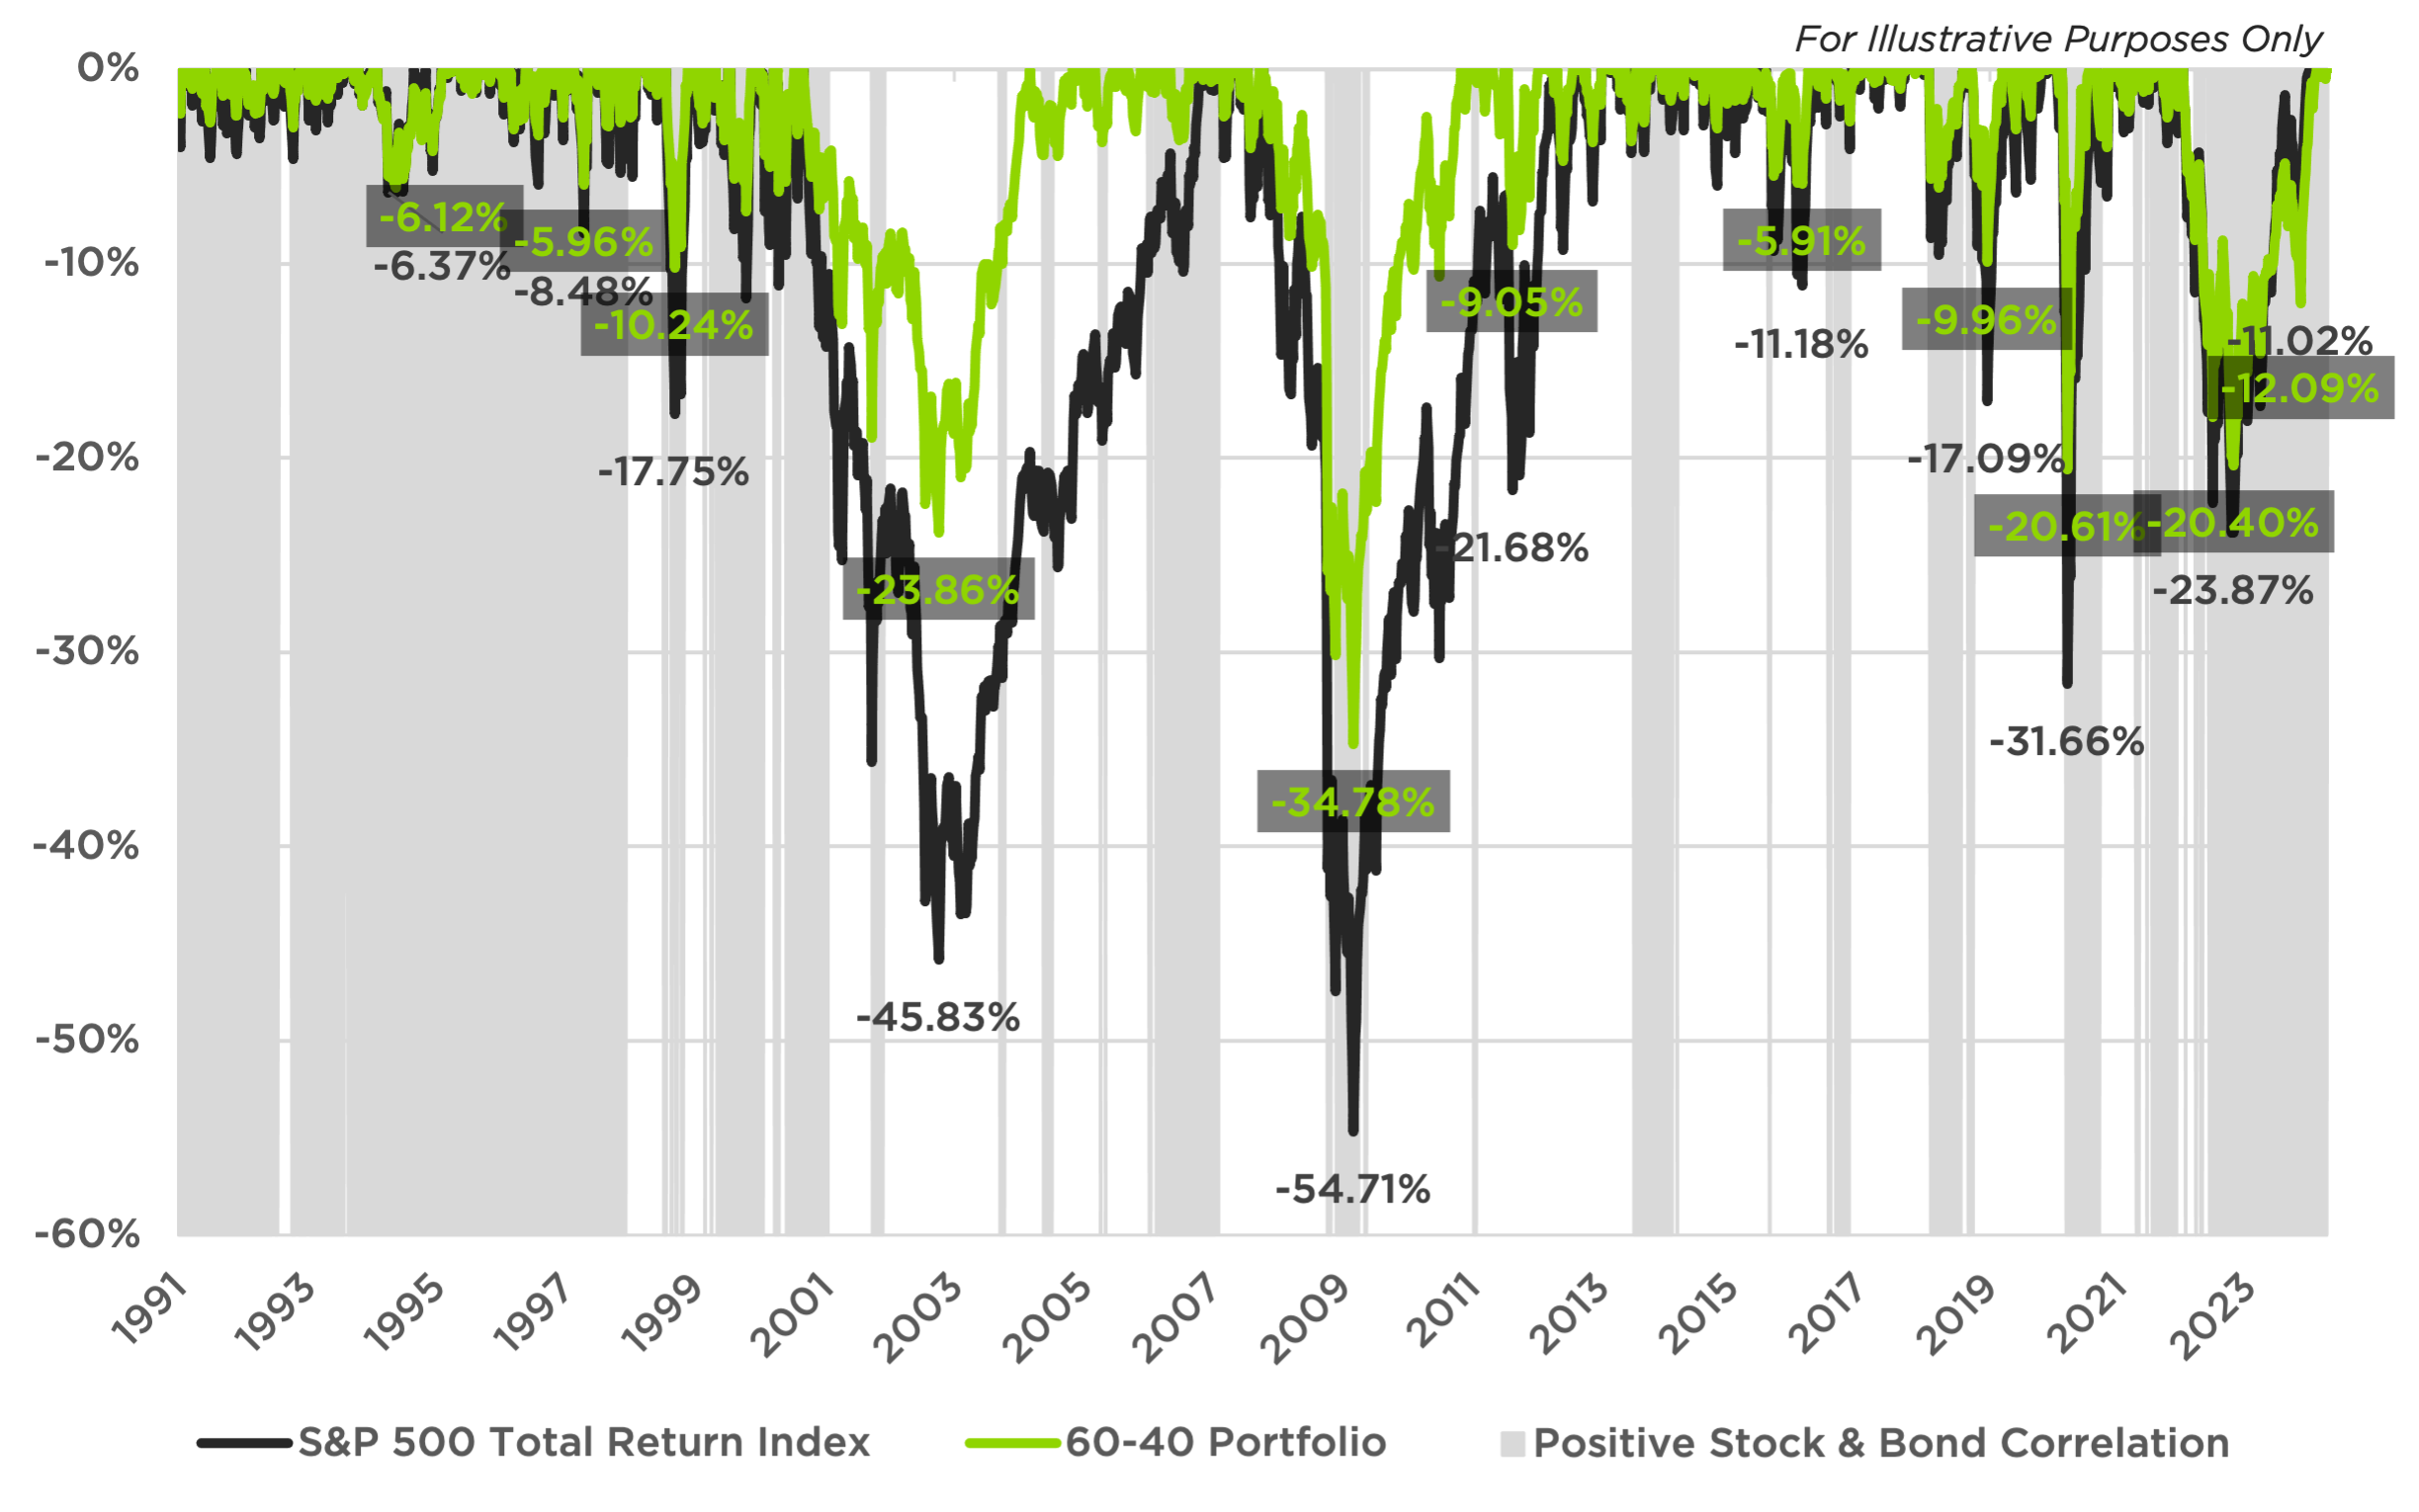
The chart above depicts the drawdown of a 60% stock and 40% bond portfolio, which is completely comprised of S&P 500 Total Return Index and Bloomberg US Aggregate Bond Index respectively, against a 100% stock portfolio with periods of positive stock and bond correlation (6-month rolling) highlighted in grey. While the 60-40 portfolio afforded investors some decent protection from drawdowns in the stock market, like during the 2001-2003 Dot Com Crash, the buffering effect is noticeably reduced when market drawdowns occur during periods of positive correlation, such as during the 2008-2009 Financial Crisis. This is even more pronounced in recent history, such as the 2022 inflation and rate hike cycle. The risk of a financial loss when correlation in the market changes, is very real for 60-40 portfolios, but does this mean the 60-40 portfolio is dead, like some might lead you to believe?
At Counterpoint, we believe the 60-40 portfolio still offers investors a great starting point that can then be optimized to investor risk-tolerance with the addition of the right quantitative diversifier strategies. Investors who rely only on past data to inform how they construct their portfolios may have a bias that favors the status quo, which limits their ability to identify new opportunities and protect against potential risks. Counterpoint aims to help address this problem by offering systematic fixed income and equity diversifier strategies, which are designed to be less correlated and provide different sources of return that can potentially smooth the investor experience, while helping drive total portfolio performance over the long-run.