Not All Diversifier Strategies Are Created Equal
At Counterpoint, we’ve been championing diversifier strategies for a while now—like the wise old friend who keeps reminding you to bring an umbrella just in
Factor Spreads are used to show how much of a gap exists in factor scoring between a top and bottom quantile in a historical context. When the gap between the most- and least-attractive stocks according to a factor measure is wide, that may signal an opportunity to invest in strategies targeting that factor. The intuition is that when factor scores between top and bottom quantile groups are large relative to history, there is more potential risk premium to be earned as a factor investor, as these spreads tend to be mean-reverting.
The development of the value factor spread concept and methodology as a predictive tool for future value factor returns was pioneered by Asness, Friedman, Krail, and Liew in “Style Timing: Value versus Growth,” Journal of Portfolio Management, 26 (Spring 2000).
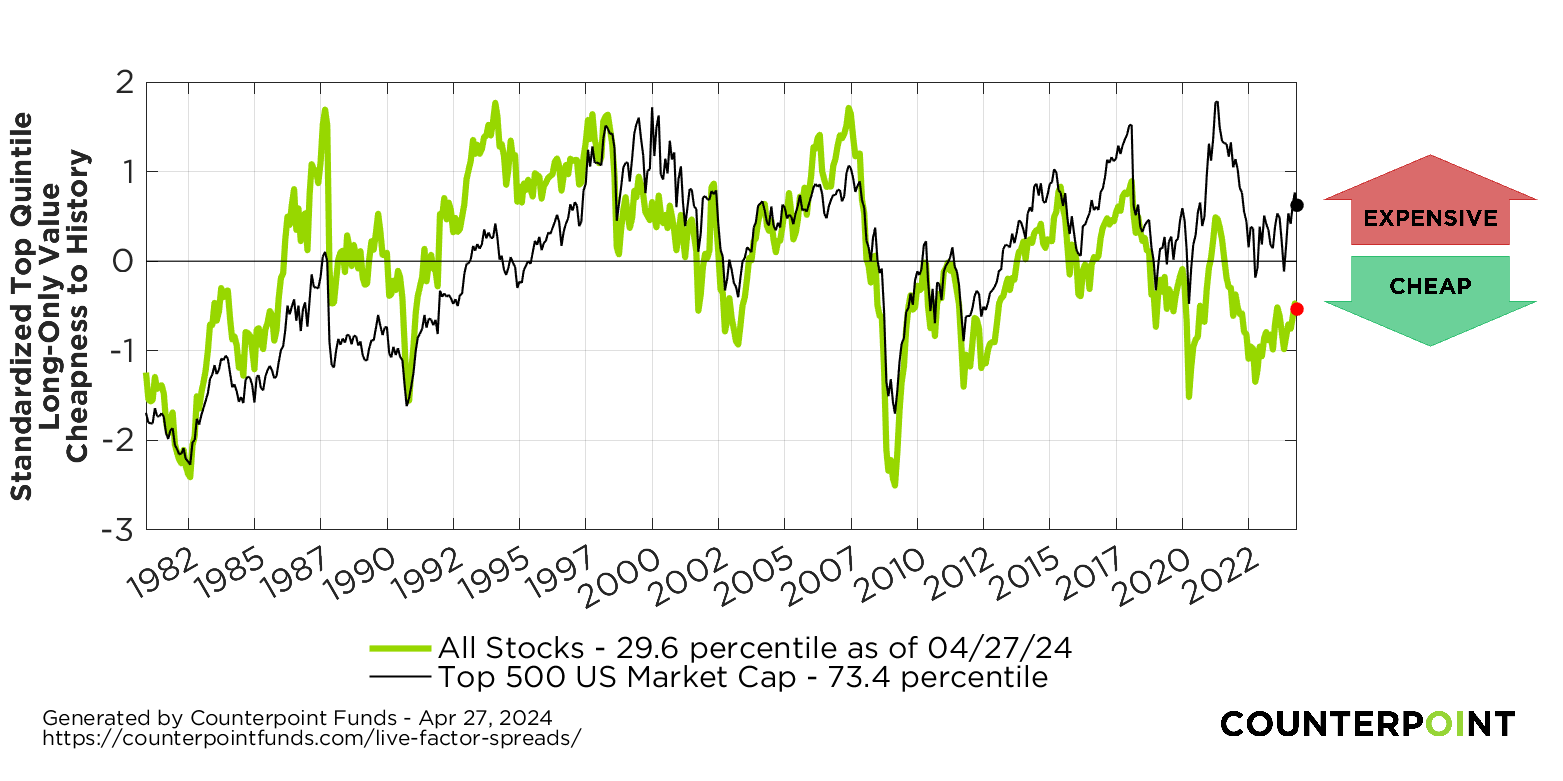
In other words, we can use a factor spread approach to see how “cheap” a long-short value strategy appears relative to the history. Likewise, we can adapt the approach to show how expensive a long-only value strategy is across a group of value factors against a historical context. To do this, we take the same data and only look at the top quantile of a chosen factor or factor category.
We can use this approach to see how much of a gap there is between stocks on other measures besides value. Depending on the factor we are looking at, a wider gap between stocks with the strongest exposure to that factor and the stocks with the least exposure could signal an opportunity to earn a great premium.
The existence of wider than normal factor spreads serves as evidence against idea that the mere awareness of investment factors such as value or low volatility leads to their disappearance via arbitrage by intelligent market participants. Only a collapse of spreads, which we see has been the opposite of actual experience, would support this premise.

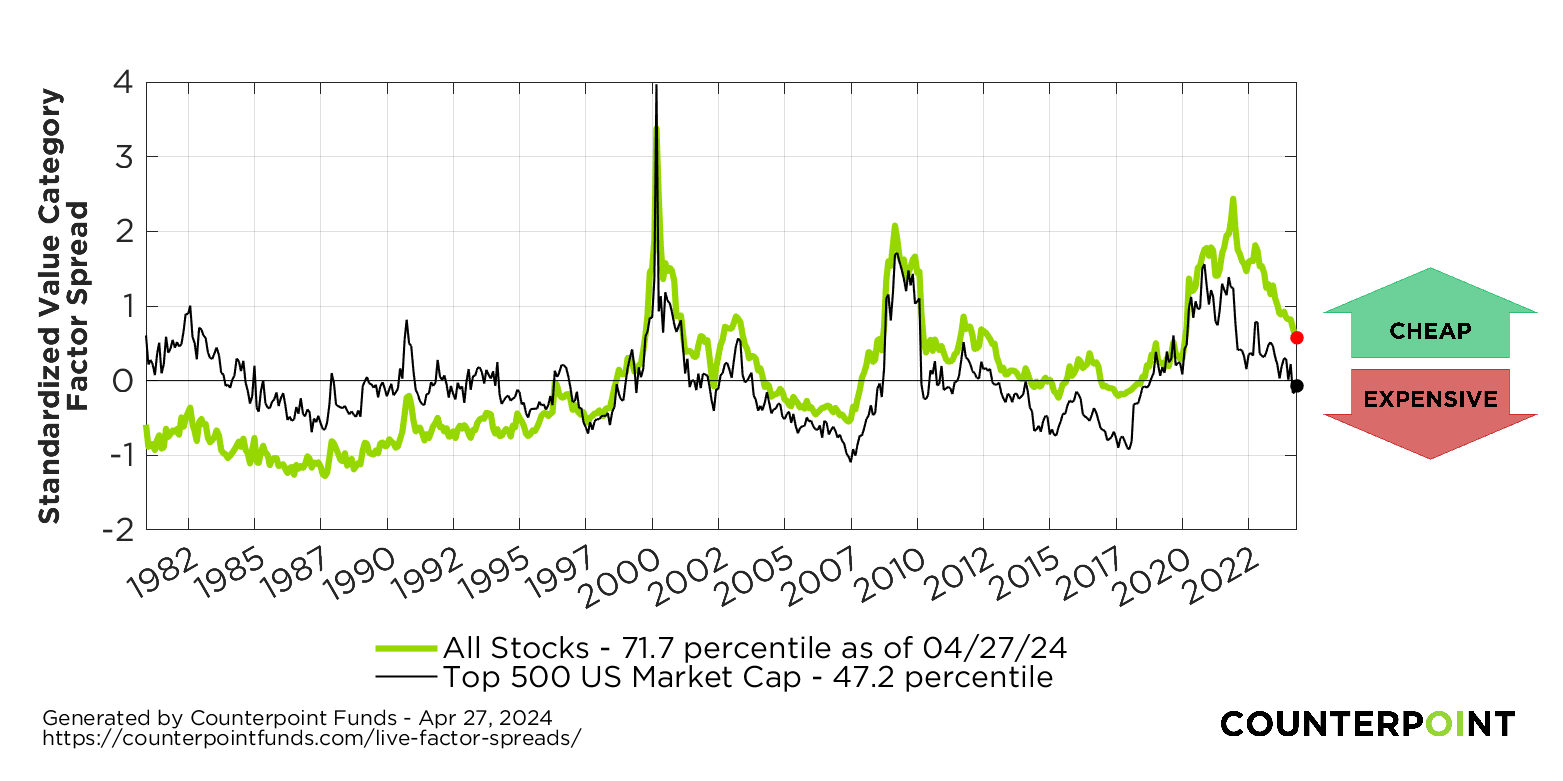
A normalized score (Z-score) above zero (representing a 50th percentile) in the long-short valuation spread indicates top quintile long-short value across several value factors is cheap relative to history. Put another way, it says the opposite of value (not exactly growth, but close enough for discussion), is expensive relative to history.

A normalized Z-score below zero (representing the 50th percentile) in the long-only chart indicates top quintile long-only value across several value factors is cheap relative to history. When the green line is below the black line, smaller-capitalization value stocks tend to be “cheaper” relative to their history than large-caps. When the green line is above the black line, the reverse is true.

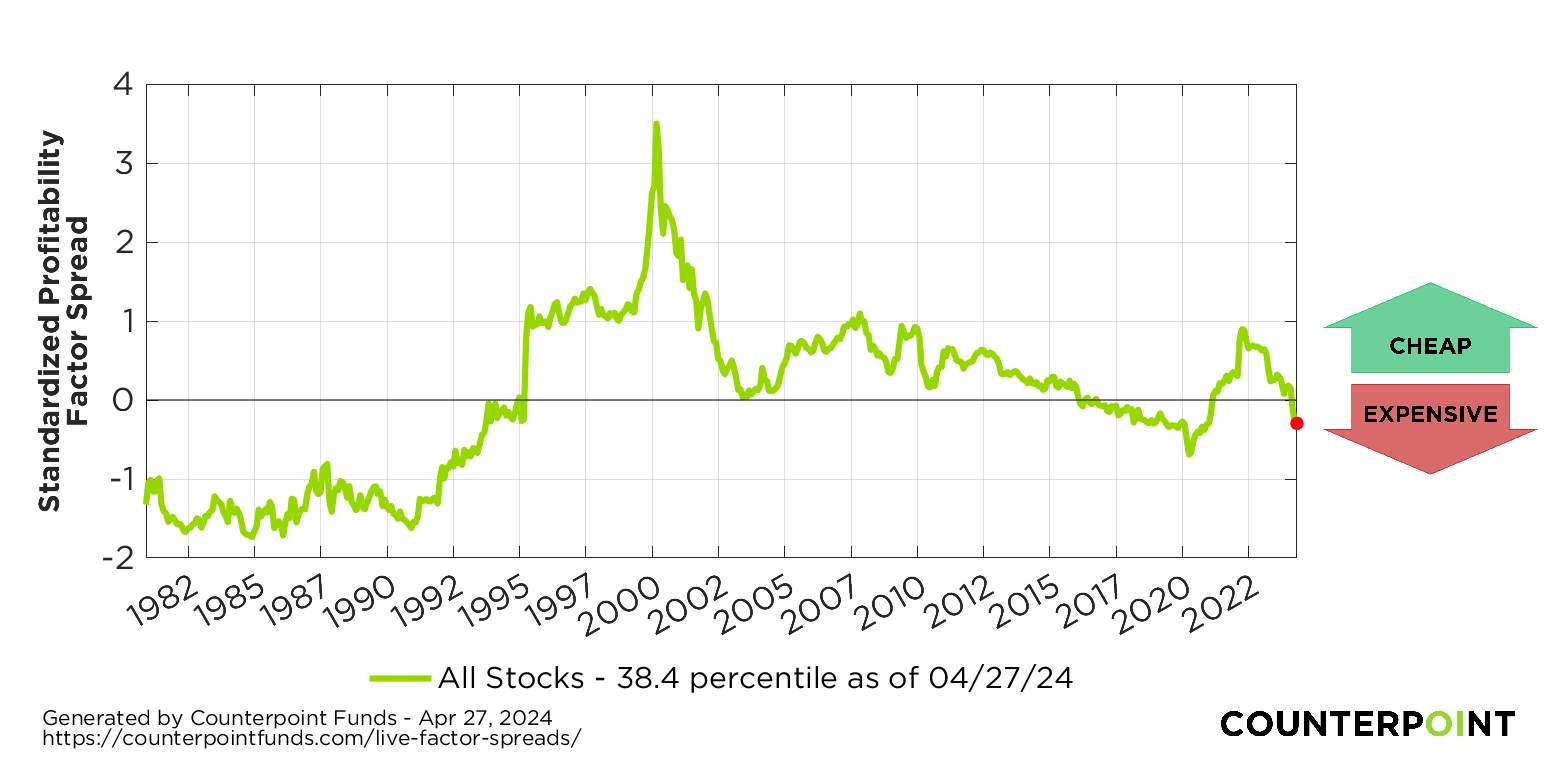
A normalized score (Z-score) above zero (representing a 50th percentile) indicates the “profitability gap” between highly profitable stocks and unprofitable stocks is wider than historical averages, and extra potential risk premium can be earned from the reversion of that gap to normal levels.

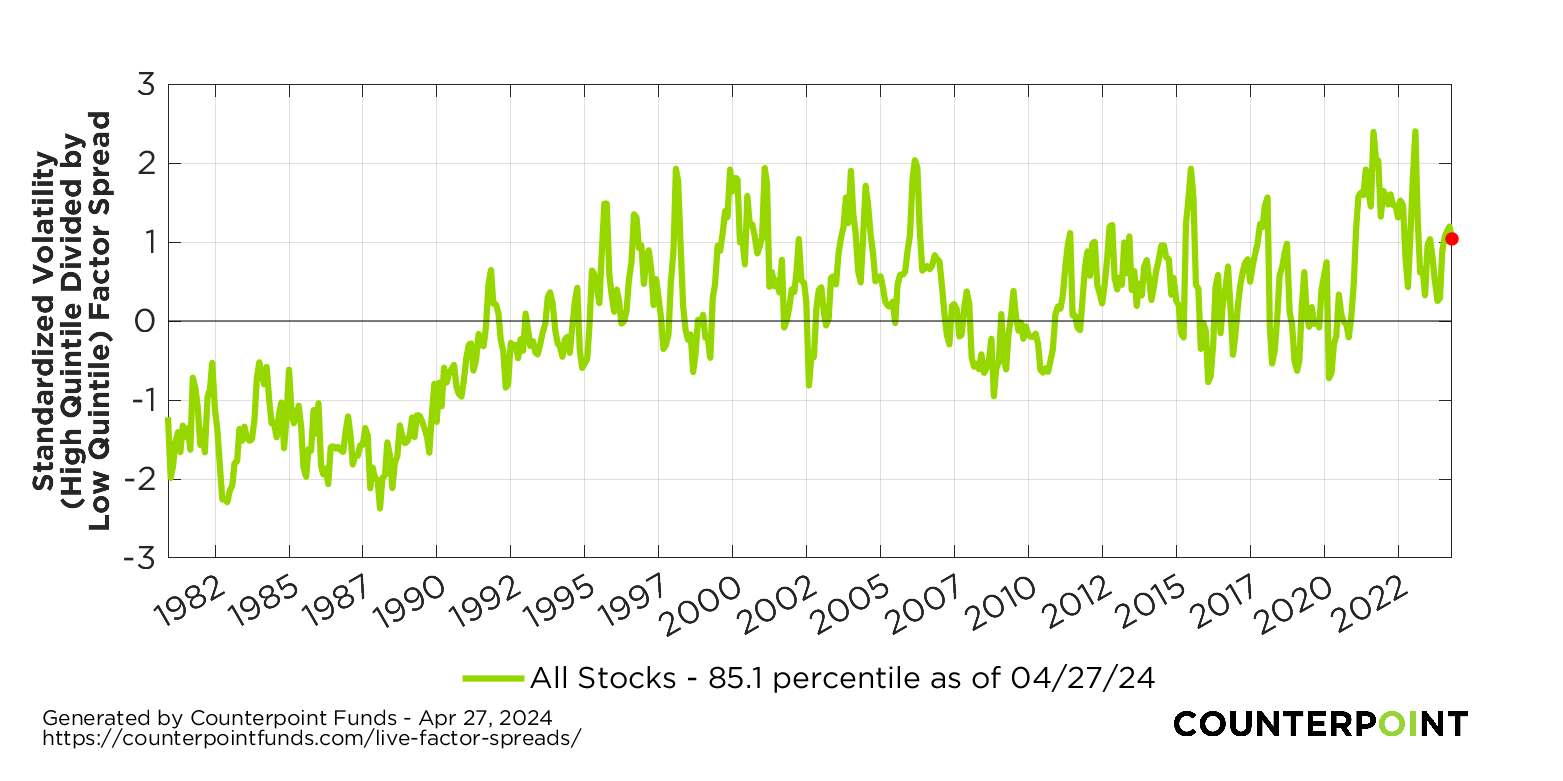
A normalized score (Z-score) above zero (representing a 50th percentile) indicates the “volatility gap” between highly volatile stocks and low volatility stocks is wider than historical averages. Implicitly, there is more collective disagreement and potential inefficiency surrounding the value of high volatility stocks versus low volatility stocks relative to history.
This is an informational resource only. The above factor spread returns do not represent holdings of Counterpoint’s Tactical Equity Fund.
Want to see how the Counterpoint Tactical Equity Fund (CPIEX) takes advantage of factor spreads to identify mispricing opportunities?
Valuation factor spreads are computed by using four valuation factors: Earnings to Price, Price to Sales, Price to Book, and Cashflow to Enterprise value. Each factor value is sorted within sector, and the top quintile is used to form the “cheap” basket while the bottom quintile is used to form the “expensive” basket. The median value within each basket is taken for every given month in the history. A ratio of these medians is computed on a monthly basis, and that series of ratios is transformed into a standardized z-score, reflecting the normalized variance from the mean historic value at any point in time.
Each factor is equal weighted, and the z-score depicted is an average of the z-score of individual factors. The percentile on each chart is derived from the z-score, assuming normality in distribution of historic measures of ratios of medians. A z-score of 0 would derive a percentile of 50% with this approach, meaning the result is at the historical mean.
Long-only “value of value” is computed identically to the above, except that the absolute value of the median from the top quintile “cheap” basket is not transformed by a ratio against the “expensive” basket referred to above.
The profitability factor spread utilizes the ratio of gross profits to average company assets. The volatility factor uses 90-day trailing realized volatility to form its sorts.
The methodology for computation of factor spreads of these two factors is the same as above, but only differs that value-related factors are not utilized. The profitability factor is sorted, and the ratio of median of the profitability factor for top and bottom quintiles are computed. The volatility factor is sorted and transformed the same way.
The universe of stocks is represented by global developed, includes no emerging markets, and all valuations imply equal weighting of chosen median values.
There is no guarantee that any investment strategy will achieve its objectives, generate profits or avoid losses.

At Counterpoint, we’ve been championing diversifier strategies for a while now—like the wise old friend who keeps reminding you to bring an umbrella just in

Year-ahead commentary is challenging for us: We don’t have a crystal ball, and we believe predictions contribute more to investment mistakes than outperformance. But the

How should an investment advisor think about building a portfolio for clients? Or how should an investor think about building a portfolio for themselves? Many

At Counterpoint, we’ve been championing diversifier strategies for a while now—like the wise old friend who keeps reminding you to bring an umbrella just in

Year-ahead commentary is challenging for us: We don’t have a crystal ball, and we believe predictions contribute more to investment mistakes than outperformance. But the

How should an investment advisor think about building a portfolio for clients? Or how should an investor think about building a portfolio for themselves? Many
Mutual Funds involve risk including the possible loss of principal. Investors should carefully consider the investment objectives, risks, charges and expenses of the funds managed by Counterpoint Funds. This and other important information about the funds is available in their prospectuses, which can be obtained at counterpointfunds.com or by calling 844-273-8637. The prospectuses should be read carefully before investing. The Counterpoint Funds fund family is distributed by Northern Lights Distributors, LLC member FINRA/SIPC. To reach the Counterpoint sales team, please refer to our contact page.
Copyright © 2023, S&P Global Market Intelligence (and its affiliates, as applicable). Reproduction of any information, data or material, including ratings (“Content”) in any form is prohibited except with the prior written permission of the relevant party. Such party, its affiliates and suppliers (“Content Providers”) do not guarantee the accuracy, adequacy, completeness, timeliness or availability of any Content and are not responsible for any errors or omissions (negligent or otherwise), regardless of the cause, or for the results obtained from the use of such Content. In no event shall Content Providers be liable for any damages, costs, expenses, legal fees, or losses (including lost income or lost profit and opportunity costs) in connection with any use of the Content. A reference to a particular investment or security, a rating or any observation concerning an investment that is part of the Content is not a recommendation to buy, sell or hold such investment or security, does not address the suitability of an investment or security and should not be relied on as investment advice. Credit ratings are statements of opinions and are not statements of fact.
5211-NLD-02/13/2023
We’ve received your request for the featured event collateral. A Counterpoint Funds team member will be in touch shortly.
Subscribe to stay up to date on and receive our monthly perspective.
We’ve received your meeting request and a Counterpoint Funds team member will be in touch shortly.
Subscribe to stay up to date on and receive our monthly perspective.
We’ve received your event registration request and will be in touch shortly.
Subscribe to stay up to date on Counterpoint Funds and receive our monthly perspective.
We have received your application and look forward to reviewing your qualifications for the role. If your application seems like a good fit, we will contact you to discuss next steps.
Thank you again for your application and interest in joining the Counterpoint team!
We’ve received your message. A Counterpoint Funds team member will contact you soon.
Subscribe to stay up to date and receive our monthly perspective.