Year-ahead commentary is challenging for us: We don’t have a crystal ball, and we believe predictions contribute more to investment mistakes than outperformance. But the New Year does...
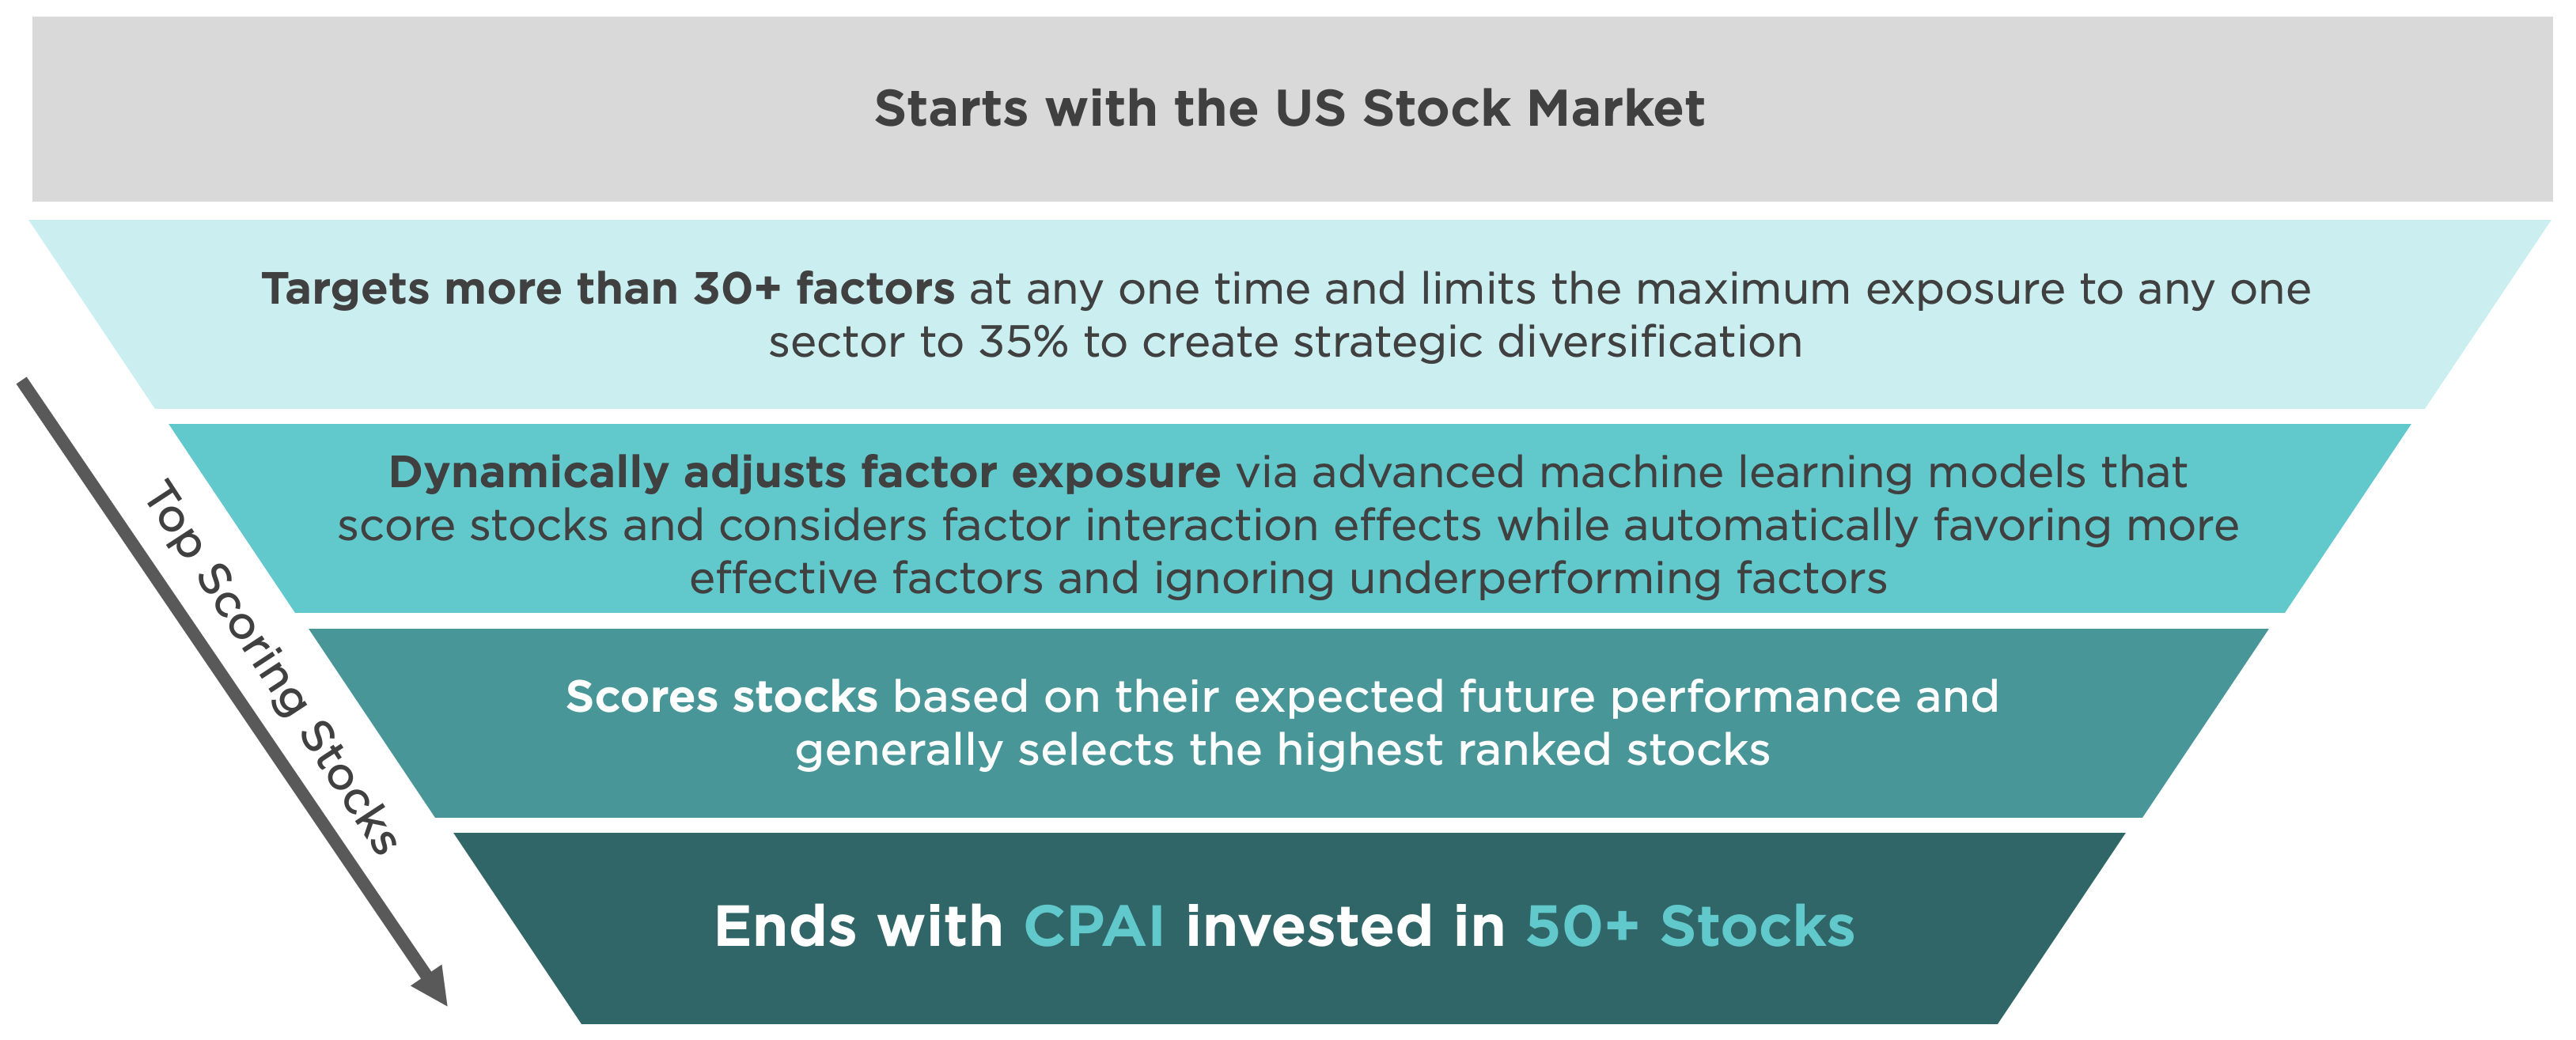
READ MOREThe Fund invests in individual stocks that have exposure to multiple factors and are among the highest-ranking stocks to hold as determined by quantitative models and artificial intelligence to seek outperformance relative to the market.
The Fund uses a blend of multiple machine learning models. These artificial intelligence models perform stock ranking, and dynamically adjust factor exposures based on changing market conditions.
Counterpoint’s empirical research has provided over 30 variables as inputs to rank stocks, which revolve around themes of value, long-term reversal, momentum, profitability, investor sentiment and price stability.
Counterpoint’s investment team leverages both published academic and proprietary research that resolve around themes which are leveraged throughout Counterpoint’s quantitative approach.
The Counterpoint Quantitative Equity ETF Fund uses multiple machine learning models to select a portfolio. The process dynamically adjusts exposure to different factors to seek outperformance relative to the market.

The Fund uses a blend of multiple quantitative machine learning models and advanced artificial intelligence techniques to most optimally score and select the highest ranked stocks.
There is no guarantee that any investment strategy will achieve its objectives, generate profits or avoid losses.
The Counterpoint Quantitative Equity ETF seeks to provide exposure to stocks with the highest predicted return, where factor exposures are dynamic depending on factor interaction effects and market conditions.
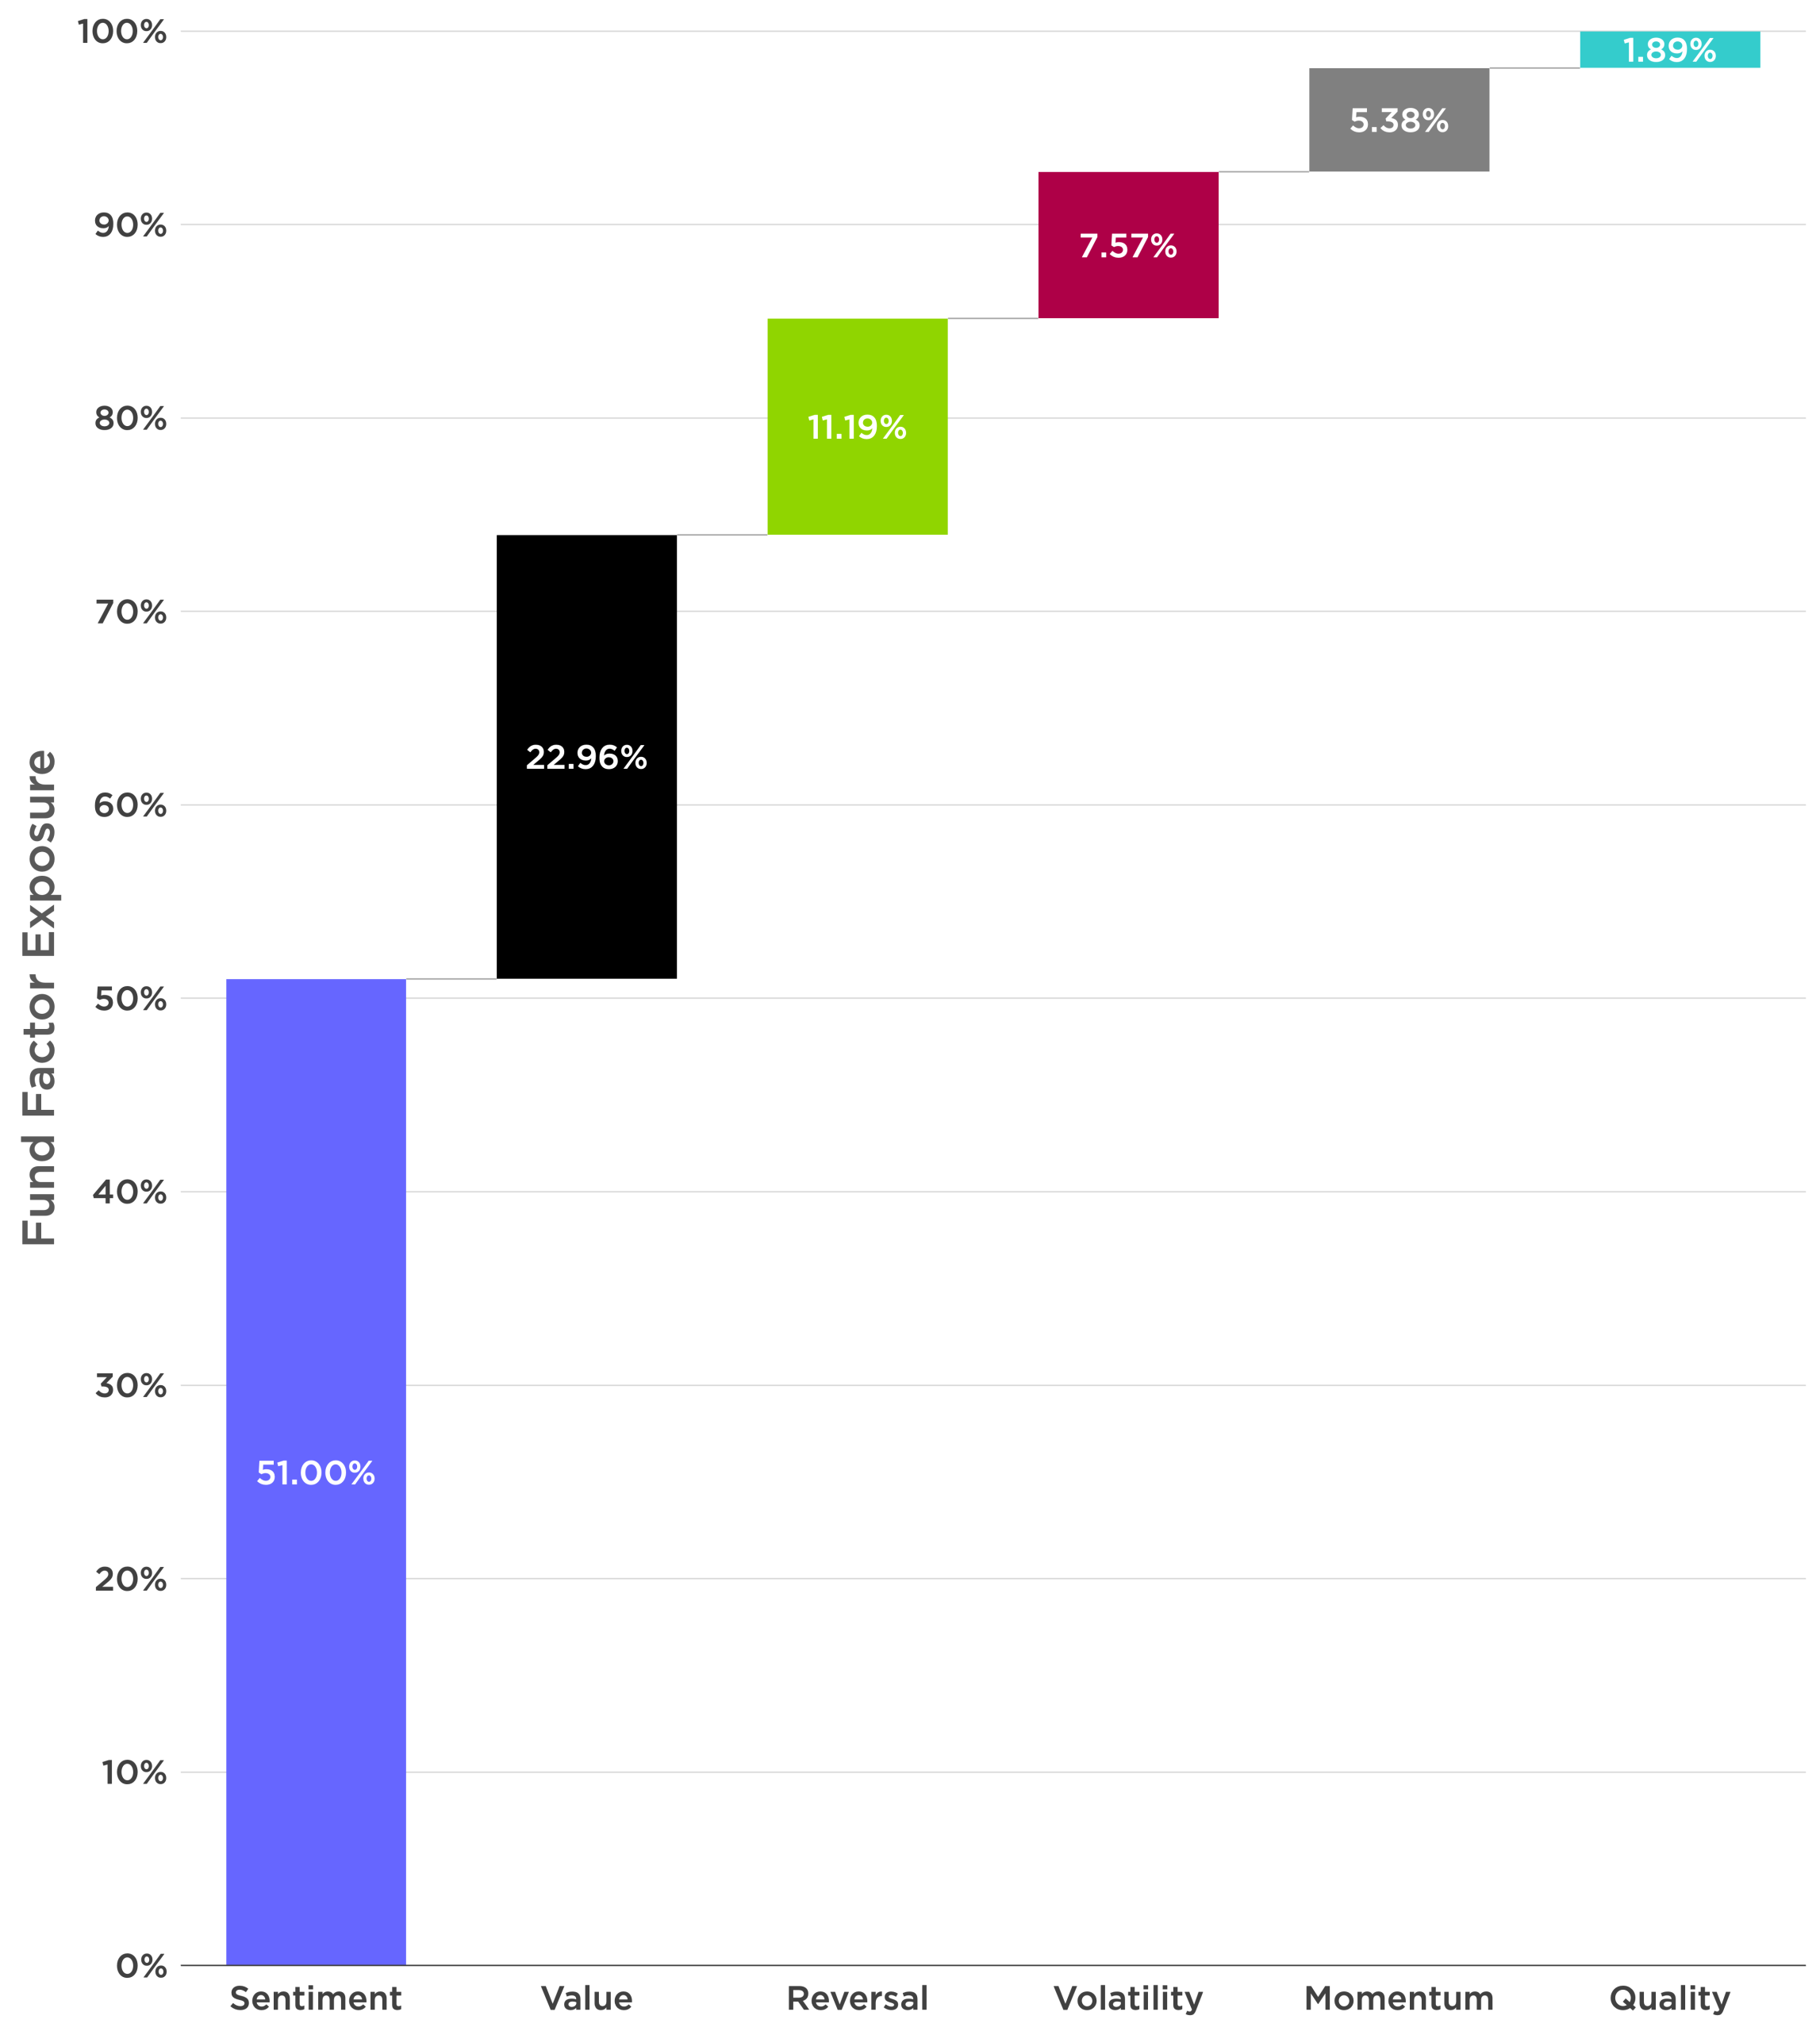
The chart below displays the current total factor weighting for CPAI as of the last rebalance. This attribution shows expected factor exposure weighting relative to a broad market portfolio.


Current factor exposures as of December 31, 2025. The chart displays the factor exposure of the stocks held by the fund as of the last rebalance. Positive and negative factor weightings must sum to 100%, so where a factor may contribute negatively in a given period, the sum of all positive factor attributions may be greater than 100%. Factor attributions below the 0% axis subtract from total excess return estimate, often indicating the model takes negative exposure to certain factors because some other factor has positive expectations that exceed the negative contribution. i.e., Volatility factor usually includes lower volatility stocks when the attribution is positive, and higher volatility stocks when the attribution is negative. Likewise, it would show High quality when positive, low quality when negative. It does not show actual investment returns or performance of the fund. Future performance is unknown.
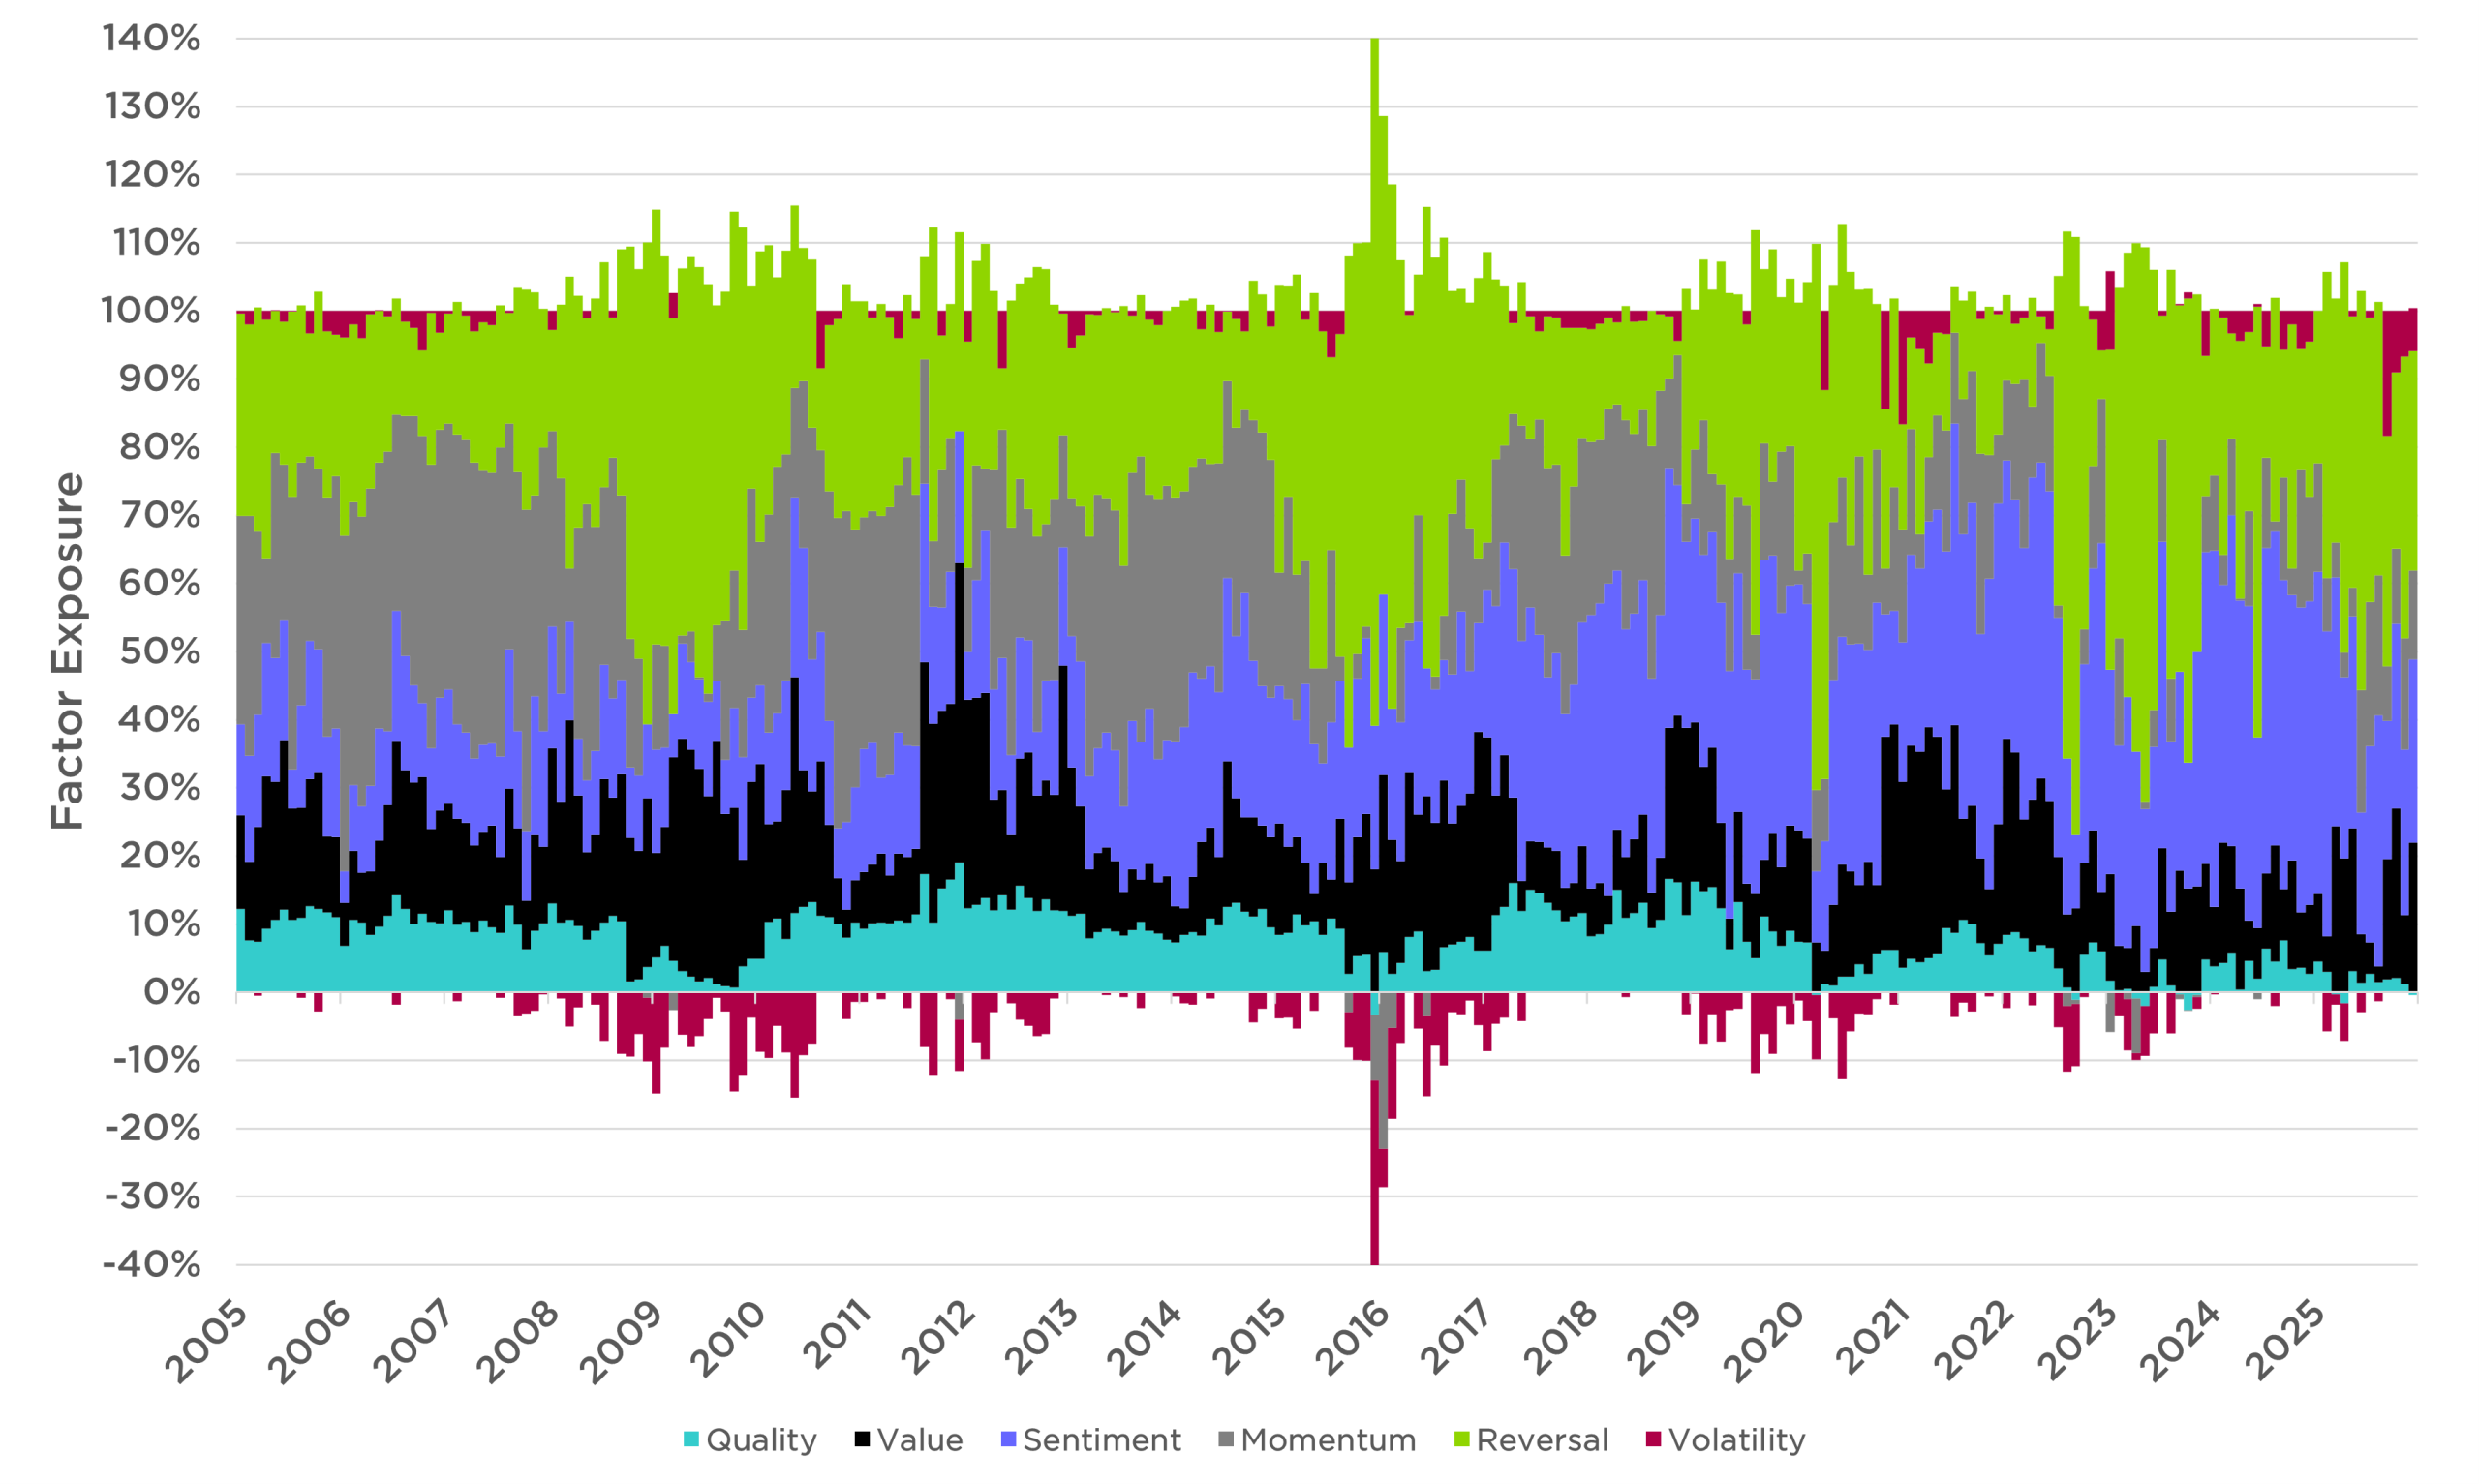
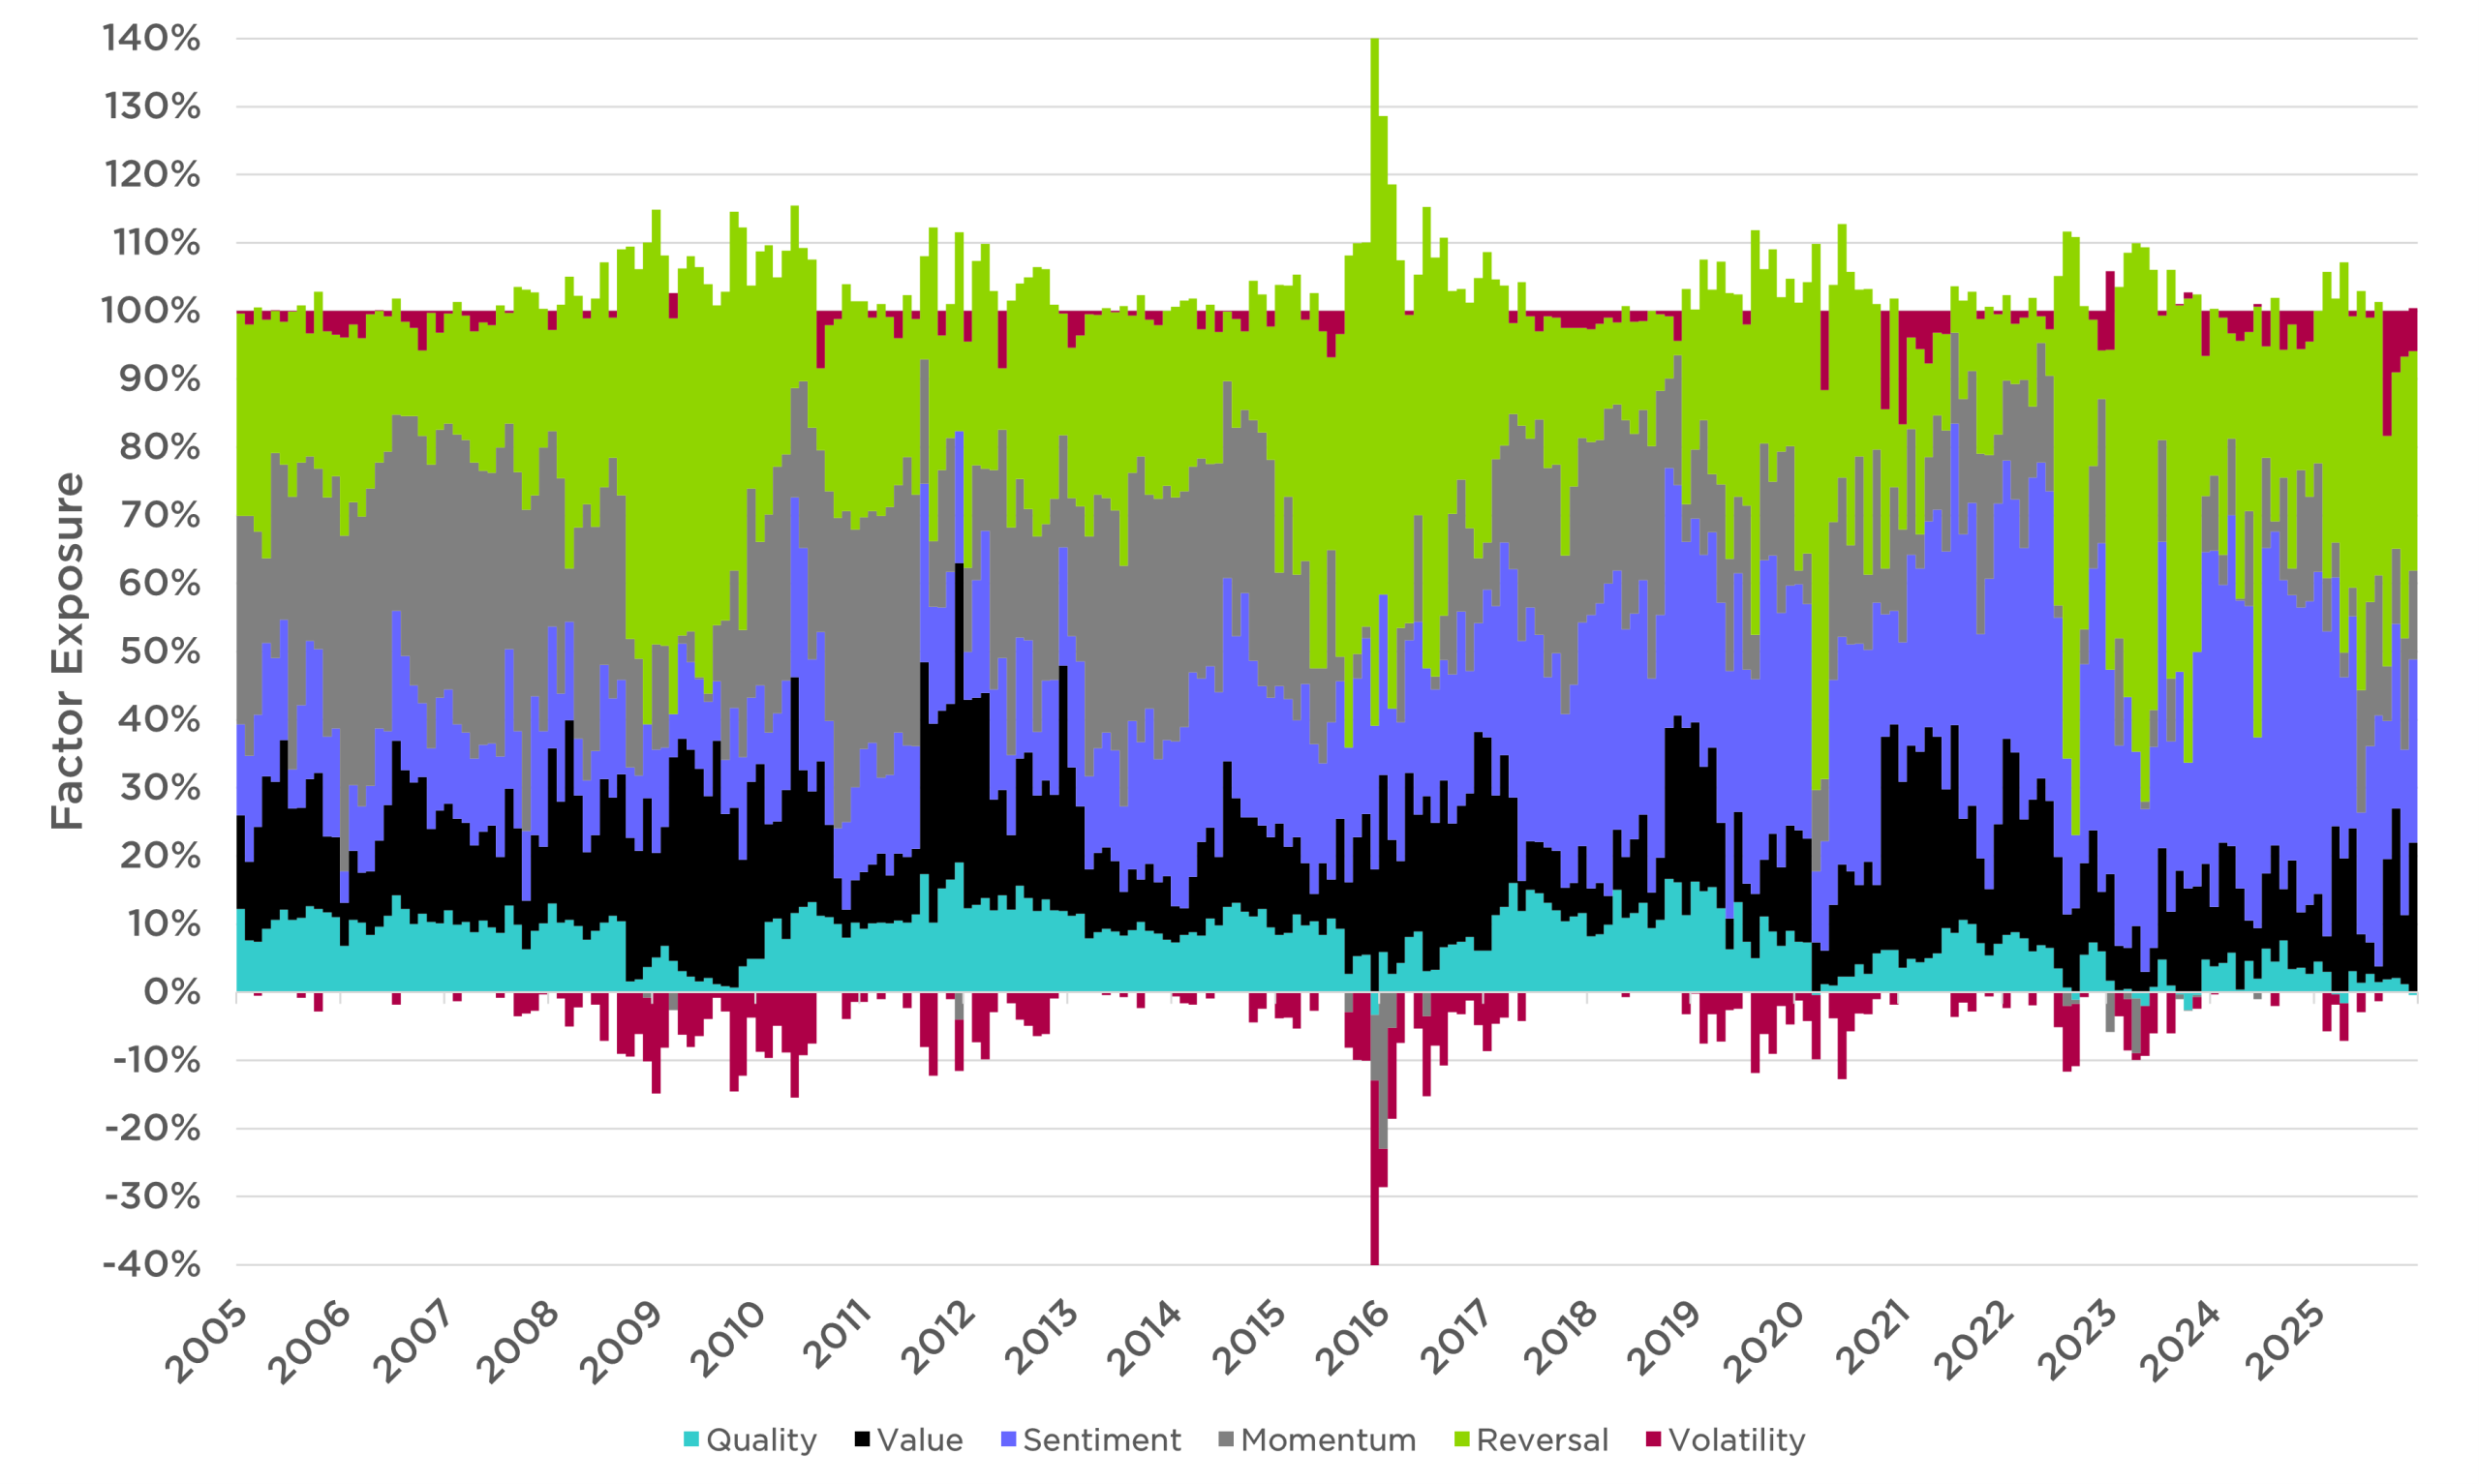
The chart below displays the dynamic nature of total factor weighting for the top 100 stocks determined by the model, rolling over time. This attribution shows expected factor exposure weighting relative to a broad market portfolio.


Time Period: January 1, 1998, to January 1, 2026. The chart displays the factor exposure of the top 100 stocks determined by the model and displays shifts in factor style over time. Positive and negative factor weightings must sum to 100%, so where a factor may contribute negatively in a given period, the sum of all positive factor attributions may be greater than 100%. Factor attributions below the 0% axis subtract from total excess return estimate, often indicating the model takes negative exposure to certain factors because some other factor has positive expectations that exceed the negative contribution. i.e., Volatility factor usually includes lower volatility stocks when the attribution is positive, and higher volatility stocks when the attribution is negative. Likewise, it would show High quality when positive, low quality when negative. It does not show actual investment returns or performance of the fund. Future performance is unknown.
Year-ahead commentary is challenging for us: We don’t have a crystal ball, and we believe predictions contribute more to investment mistakes than outperformance. But the New Year does...
READ MOREOne of the most common questions we hear from advisors and their clients is: How does A.I. actually work in quantitative investing? While the jargon around machine learning...
READ MORESince the market bottomed on April 8, 2025, investors have witnessed a highly speculative, “pro-junk” environment. Stocks with weak fundamentals—richly valued, unprofitable companies often fueled by hype—have surged...
READ MORE| As of 2026-02-13 | 1 DAY | 1 MO | 3 MO | 6 MO | 1 YR | YTD | QTD | SINCE INCEPTION | |
|---|---|---|---|---|---|---|---|---|---|
| Market Price | 42.77 | 1.11% | -2.44% | 10.25% | 18.38% | 16.43% | 6.66% | 6.66% | 28.26% |
| NAV | 42.73 | 1.26% | -2.26% | 10.14% | 18.24% | 16.23% | 6.83% | 6.83% | 28.21% |
| As of 2025-12-31 | 1 MO | 3 MO | 6 MO | 1 YR | YTD | QTD | SINCE INCEPTION | |
|---|---|---|---|---|---|---|---|---|
| Market Price | 40.1 | 0.41% | 2.45% | 8.78% | 17.81% | 17.81% | 2.45% | 26.17% |
| NAV | 40 | 0.19% | 2.32% | 8.57% | 17.62% | 17.62% | 2.32% | 26.01% |
| Days Traded at Premium | Days Traded At Discount | |
|---|---|---|
| Calendar Year 2025 | 159 | 60 |
| Q1 2026 | 29 | 1 |
The performance data displayed here represents past performance, which is no guarantee of future results. Current performance may be lower or higher than the performance data quoted. The investment return and principal value of an investment will fluctuate so that investor’s shares, when redeemed, may be worth more or less than their original cost. For performance information current to the most recent month-end, please call toll-free 844-273-8637.
The Counterpoint Quantitative Equity Fund seeks to provide capital appreciation while managing downside risk. The Fund invests in individual stocks that have exposure to multiple market anomalies, while using a tactical model to dynamically adjust portfolio risk.
FUND DETAILS
As Of 2026-02-13
Ticker CPAI
Primary Exchange NYSE
Cusip 66538R540
ISIN US66538R5404
Inception Date 2023-11-28
Net Assets $188,418,585
Shares Outstanding 4,410,000
Volume 21,878
30 Day Median Mid Bid-Ask Spread 0.2289%
Net Expense Ratio (After Waivers) 0.75%
Advisor Management Fee 0.65%
The Adviser has contractually agreed to waive its fees and reimburse expenses of the Fund, until at least February 1, 2026 to ensure that total annual fund operating expenses after fee waiver and/or reimbursement will not exceed 0.75% of the Fund’s net assets. This is excluding (i) of any front-end or contingent deferred loads; (ii) brokerage fees and commissions; (iii) acquired fund fees and expenses; (iv) fees and expenses associated with investments in other collective investment vehicles or derivative instruments (including for example option and swap fees and expenses); (v) borrowing costs (such as interest and dividend expense on securities sold short); (vi) taxes; and (vii) extraordinary expenses, such as litigation expenses (which may include indemnification of Fund officers and Trustees, contractual indemnification of Fund service providers, other than the Adviser). This fee waiver and expense reimbursement are subject to possible recoupment from the Fund within the three years after the fees have been waived or reimbursed, if such recoupment can be achieved within the lesser of the foregoing expense limits in place at the time of recapture. This agreement may be terminated only by the Trust’s Board of Trustees on 60 days’ written notice to the Adviser.
Download Holdings
NAME SYMBOL NET ASSET % MARKET PRICE($) SHARES HELD MARKET VALUE
BROOKDALE SR BKD US 2.89 16.31 329,573 $5,375,335.63
ADVANCE AUTO PAR AAP US 2.83 58.22 90,327 $5,258,837.94
MICRON TECH MU US 2.68 413.97 12,066 $4,994,962.02
TERAWULF INC WULF US 2.52 15.91 295,117 $4,695,311.47
QNITY ELECTRONIC Q US 2.52 108.54 43,133 $4,681,655.82
GPGI INC GPGI US 2.44 24.69 183,561 $4,532,121.09
VIATRIS INC VTRS US 2.39 15.79 282,149 $4,455,132.71
HERBALIFE LTD HLF US 2.36 16.08 272,696 $4,384,951.68
OKEANIS ECO TANK ECO US 2.35 41.67 104,861 $4,369,557.87
ROIVANT SCIENCES ROIV US 2.34 26.75 162,643 $4,350,700.25
Ex-Date Record Date Pay Date Short-Term Capital Gains Long-Term Capital Gains Dividend Income Total Distribution
12/12/2025 12/12/2025 12/17/2025 0.3577 0.3577
12/12/2024 12/12/2024 12/18/2024 0.1407 0.1407
12/14/2023 12/15/2023 12/20/2023 0.0154 0.0154
Investments in the Counterpoint Quantitative Equity ETF involves risk including possible loss of principal and may not be suitable for all investors. The Fund is new with a limited history of operations. There is no assurance that the Fund’s strategy for allocating assets will achieve its investment objectives. The extent that Authorized Participants (AP) exit the business or are unable to proceed with creation or redemption orders, Fund shares may be more likely to trade at a premium or discount to net asset value and possibly face trading halts or delisting. Issuers of a security and other instruments may not be able to make principal and interest payments when due. Fluctuation in the value of equity securities held by the Fund causes the net asset value of the Fund to fluctuate. You should consider how you investment in Shares will be taxed and consult your own tax professional about the tax consequences of an investment in Shares.
The Fund is structured as an ETF and is subject to risks including, market price variance, trading issues and not being individually redeemable. ETF investments involve advisory and other expenses which will be indirectly paid by the Fund. The Adviser’s judgments about the growth, value or potential appreciation of an investment may prove to be incorrect or fail to have the intended results, which could adversely impact the Fund’s performance and cause it to underperform relative to its benchmark, or not to achieve its investment goal. Like any quantitative analysis, the Adviser’s investment model carries a risk that the model used might be based on one or more incorrect assumptions. Rapidly changing and unforeseen market dynamics could lead to a decrease in the short-term effectiveness of the model and could have an adverse effect on the securities selected for the Fund. No assurance can be given that the Fund will be successful under all or any market conditions.
Factor Definitions
“Quality” rankings are based on financial statement quality characteristics, i.e. the Profitability anomaly. “Momentum” rankings based on historical market returns that have predictive characteristics. “Sentiment” rankings reflect indicators of outlook such as revisions to analyst estimates of future earnings, share issuance changes, or measures of short interest and demand in the share lending market. “Value” rankings based on measures of company valuation such as price/sales ratio, and prices/earnings ratio. “Volatility” or stability rankings based on measures of underlying company risk, such as volatility or beta.
7988-NLD-11/27/2023
We’ve received your request for the featured event collateral. A Counterpoint Funds team member will be in touch shortly.
Subscribe to stay up to date on and receive our monthly perspective.
We’ve received your meeting request and a Counterpoint Funds team member will be in touch shortly.
Subscribe to stay up to date on and receive our monthly perspective.
We’ve received your event registration request and will be in touch shortly.
Subscribe to stay up to date on Counterpoint Funds and receive our monthly perspective.
We have received your application and look forward to reviewing your qualifications for the role. If your application seems like a good fit, we will contact you to discuss next steps.
Thank you again for your application and interest in joining the Counterpoint team!
We’ve received your message. A Counterpoint Funds team member will contact you soon.
Subscribe to stay up to date and receive our monthly perspective.