There is no guarantee that any investment strategy will achieve its objectives, generate profits or avoid losses. Important information about the fund is available in their prospectuses, which can be obtained at counterpointfunds.com or by calling 844-273-8637. The prospectuses should be read carefully before investing. Investors should carefully consider the investment objectives, risks, charges, and expenses of the funds managed by Counterpoint Mutual Funds. The Counterpoint Mutual Funds fund family is distributed by Northern Lights Distributors, LLC member FINRA/SIPC. Counterpoint Mutual Funds, LLC is not affiliated with Northern Lights Distributors, LLC member FINRA/SIPC.
Important Risk Information
Mutual Funds involve risk including the possible loss of principal. The use of leverage by the Fund or an Underlying Fund, such as borrowing money to purchase securities or the use of derivatives, will indirectly cause the Fund to incur additional expenses and magnify the Fund’s gains or losses. Derivative instruments involve risks different from, or possibly greater than, the risks associated with investing directly in securities and other traditional investments. There is a risk that issuers and counterparties will not make payments on securities and other investments held by the Funds, resulting in losses to the Fund. The Funds may invest in high yield securities, also known as “junk bonds.” High yield securities provide greater income and opportunity for gain but entail greater risk of loss of principal. Past performance is no guarantee of future results. There is no assurance the Funds will meet their stated objectives.
Investments cannot be made in an index. Unmanaged index returns do not reflect any fees, expenses or sales charges. Past performance is no guarantee of future results. There is no guarantee that any investment will achieve its objectives, generate positive returns, or avoid losses. The Adviser’s reliance on its strategy and judgments about the attractiveness, value and potential appreciation of particular securities and the tactical allocation among investments may prove to be incorrect and may not produce the desired results. No level of diversification can ensure profits or guarantee against loss.
Like any quantitative analysis, the Adviser’s investment models carry a risk that the models used might be based on one or more incorrect assumptions including as a result of the Adviser’s incorrect assumptions and assessment with respect to the quality and/or relevance of the inputs and relationship between inputs. The possibility of an inaccurate or incorrect assessment of data by machine learning software can negatively impact the effectiveness of a model. Rapidly changing and unforeseen market dynamics could lead to a decrease in the short-term effectiveness of the models and could have an adverse effect on the securities selected for the Fund. No assurance can be given that the Fund will be successful under all or any market conditions.
Index Definitions
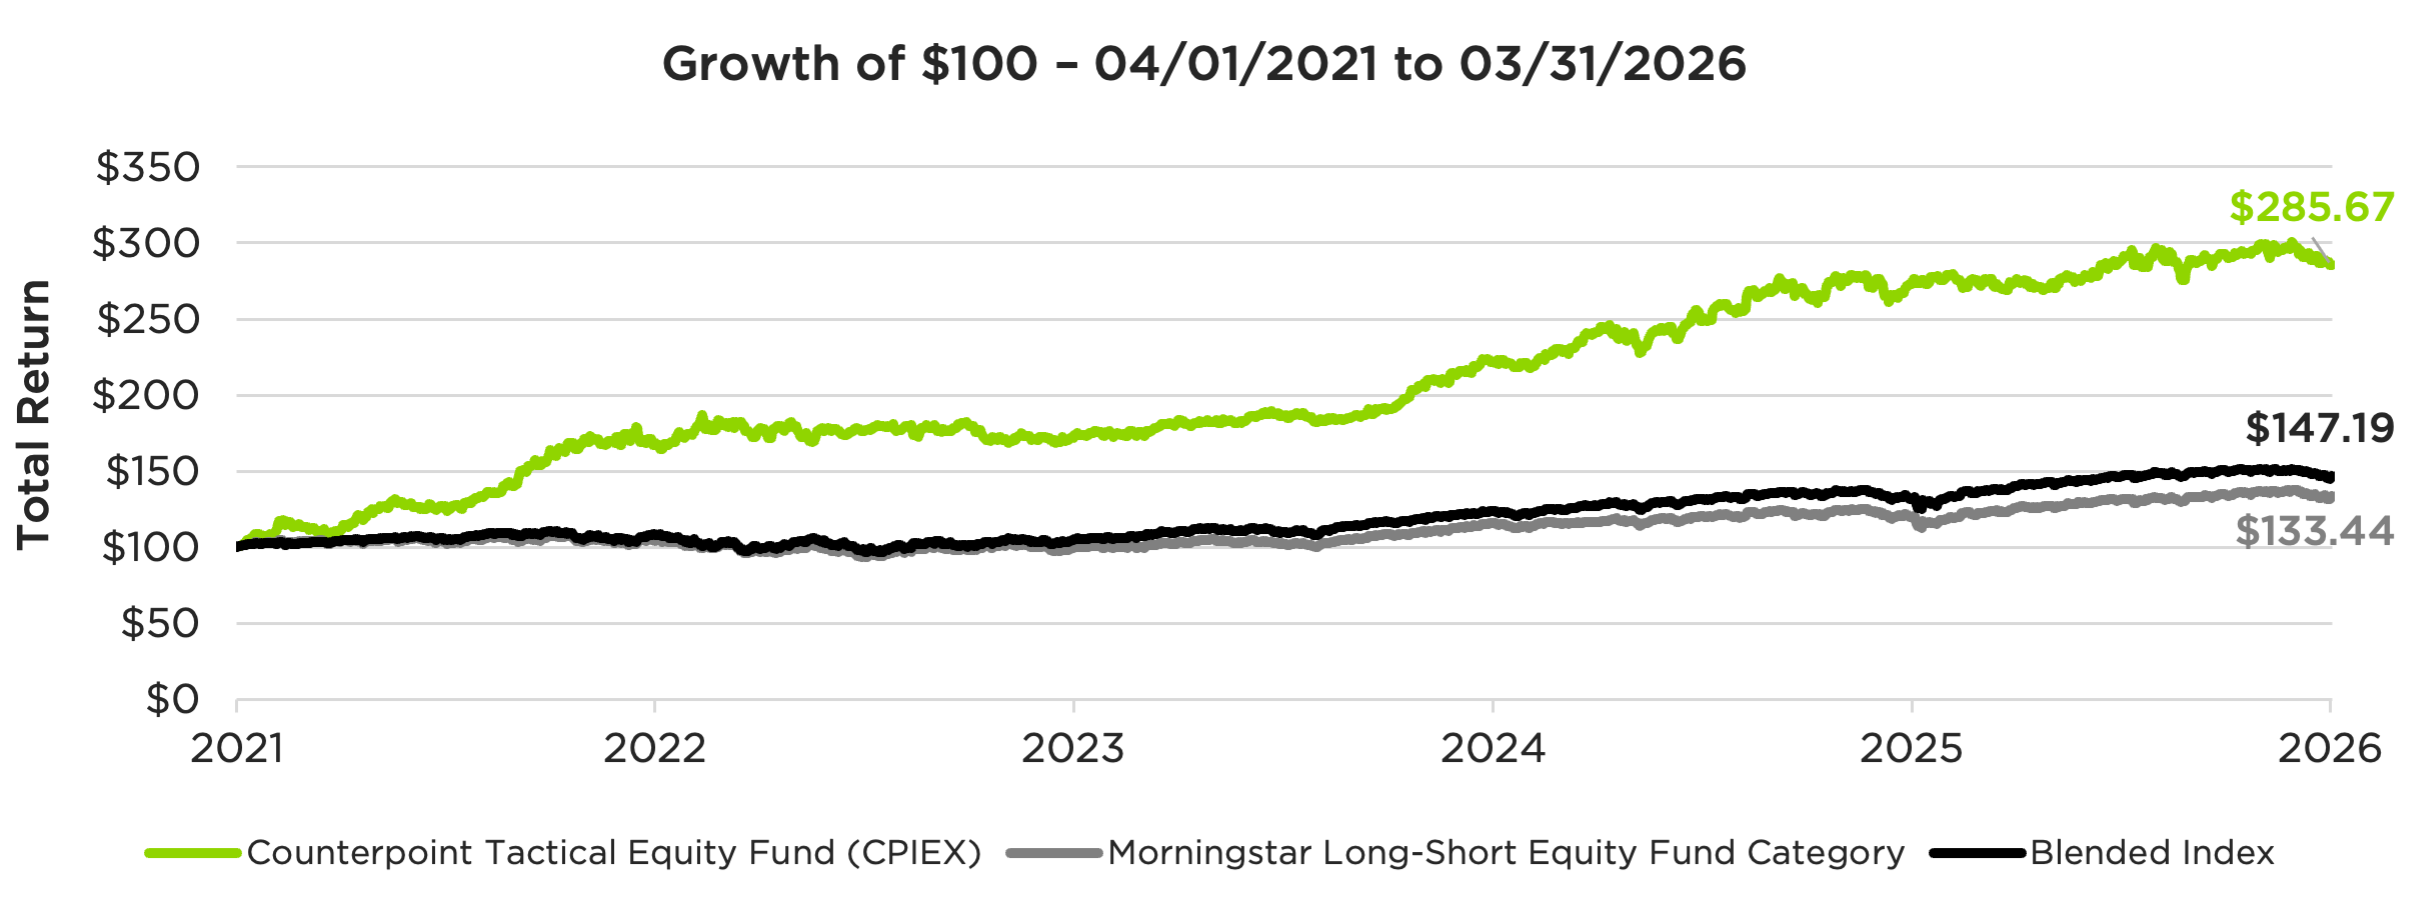
1CPIEX’s Blended Index is a composite of 50% of the S&P 500 Total Return Index and 50% of the Bloomberg 1-3 Month U.S. Treasury Bill Index. Index returns assume reinvestment of dividends. Investors may not invest in the Index directly. Unlike the Fund’s returns, the Index does not reflect any fees or expenses.
The Morningstar US Long-Short Equity category is made up of portfolios that take a net long stock position, meaning the total market risk from the long positions is not completely offset by the market risk of the short positions. Long-short equity funds’ total return, therefore, is a combination of the return from market exposure (beta) plus any value-added from stock-picking or market-timing (alpha).
The S&P 500 Total Return Index or Standard & Poor’s 500 Index, is a market-capitalization-weighted index of 500 leading publicly traded companies in the U.S.
Definitions
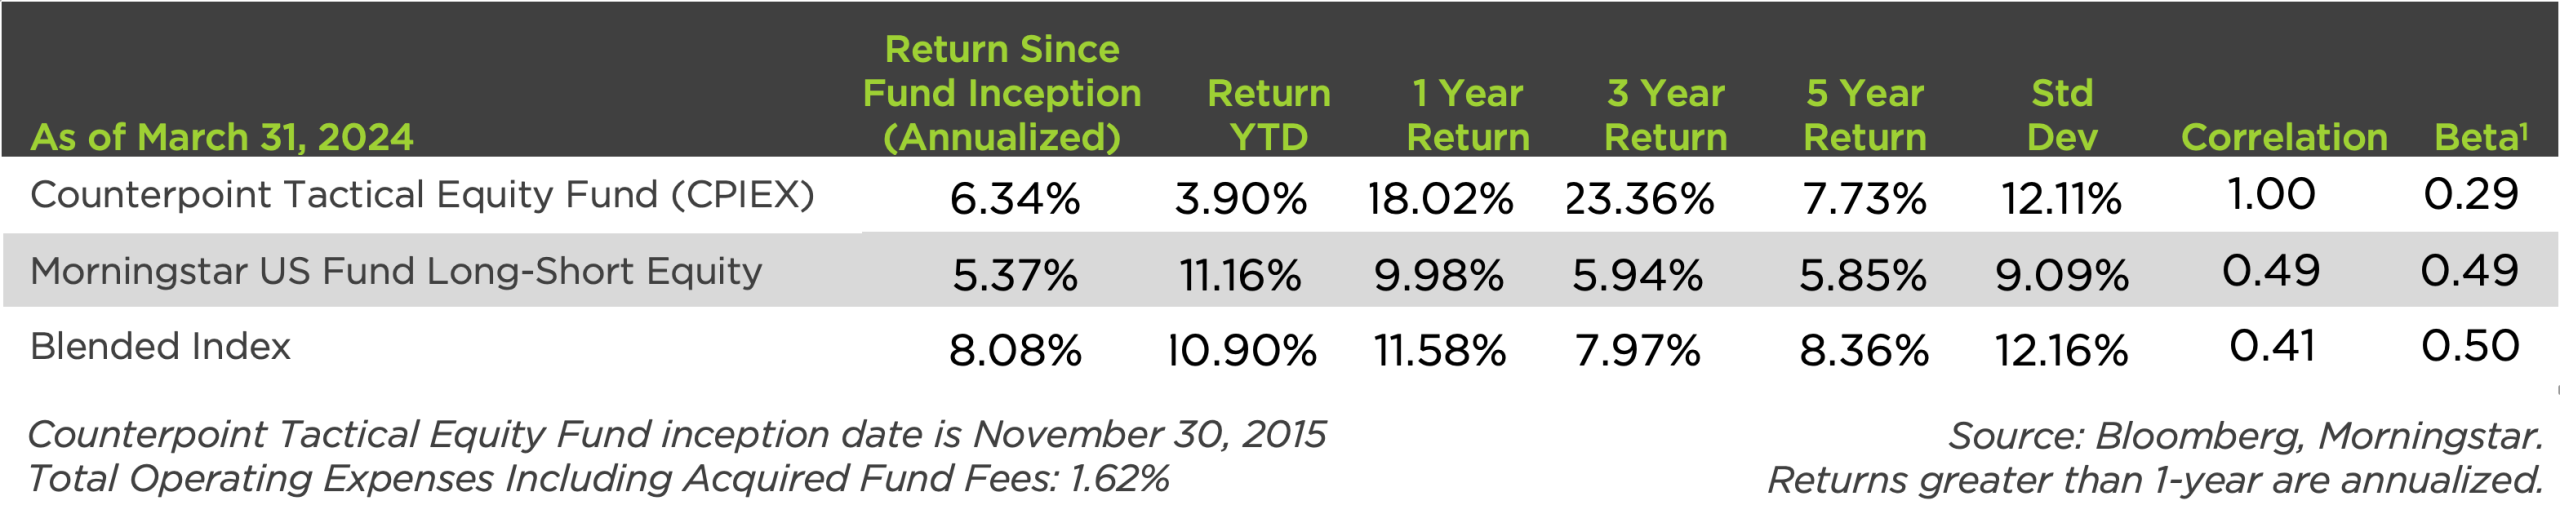
Return is the percentage change in the value of an investment, and/or cash flows which the investor receives from that investment, such as interest payments, coupons, cash dividends, stock dividends or the payoff from a derivative or structured product, over a specified time period.
Standard Deviation (Std Dev) measures the dispersion of returns relative to its mean to determine the volatility of an investment and is calculated as the square root of the variance by determining the deviation of daily returns relative to the mean.
Correlation is a statistic (between or equal to 1 and 0) that measures the degree to which two securities move in relation to each other.
Morningstar
© 2026 Morningstar. All Rights Reserved. The information contained herein: (1) is proprietary to Morningstar and/or its content providers; (2) may not be copied or distributed; and (3) is not warranted to be accurate, complete or timely. Neither Morningstar nor its content providers are responsible for any damages or losses arising from any use of this information. Past performance is no guarantee of future results.
The Morningstar Rating™ for funds, or “star rating”, is calculated for managed products (including mutual funds, variable annuity and variable life subaccounts, exchange-traded funds, closed-end funds, and separate accounts) with at least a three-year history. Exchange-traded funds and open-ended mutual funds are considered a single population for comparative purposes. It is calculated based on a Morningstar Risk Adjusted Return measure that accounts for variation in a managed product’s monthly excess performance, placing more emphasis on downward variations and rewarding consistent performance. The Morningstar Rating does not include any adjustment for sales loads. The top 10% of products in each product category receive 5 stars, the next 22.5% receive 4 stars, the next 35% receive 3 stars, the next 22.5% receive 2 stars, and the bottom 10% receive 1 star. The Overall Morningstar Rating for a managed product is derived from a weighted average of the performance figures associated with its three-, five-, and 10-year (if applicable) Morningstar Rating metrics. The Morningstar Rating is for the Institutional, A-share, and C-share class. Morningstar Percentile Rankings are based on the average annual total returns of the funds in the category for the periods stated and do not include any sales charges or redemption fees. The highest (or most favorable) percentile rank is 1 and the lowest (or least favorable) percentile rank is 100. Rankings for each share class will vary due to different expenses.
Morningstar Category/Morningstar Category % Rank Investments are placed into Morningstar categories based on their compositions and portfolio statistics so that investors can make meaningful comparisons. Morningstar Category % Rank is a fund’s total-return percentile rank relative to all funds in the same category. The highest (or most favorable) percentile rank is one and the lowest (or least favorable) percentile rank is 100. The Category % Rank complements the Morningstar Rating, especially for funds in smaller categories because these funds may have received a 3-star rating but could be in the top half of their category performance.
20260513-5479858