While some politicians and market commentators have called recent inflationary pressures transitory, it’s by no means clear we are out of the woods. Economic data have lately started to line up with narratives we’ve been hearing all year. As workers strike and supply chain issues persist, the year-over-year change in consumer price levels recently hit 6.2%. In the past 50 years, we’ve only seen the CPI jump that fast three times – in the early 1970s, the early 1990s, and in 2008. Amid concerns that this inflationary jolt may create financial market disruptions, investors may be wondering whether they should load up on cash.
Our analysis says: Probably not. Standard theory says investors should hold cash in proportion to their tolerance for risk and their short-term liquidity needs – not in response to recent headlines or economic data. To test that theory, let’s examine how cash has historically affected portfolio performance after inflation spikes.
Cash has a mixed performance record following inflation spikes
Most investors understand that cash (for our purposes, money market investments) generally doesn’t return much. But it’s worth looking at recent history to help us understand how much benefit or drag a boosted cash position might have created in periods after the CPI rose sharply.
Year-Over-Year Change in Consumer Price Index, 1972-Present
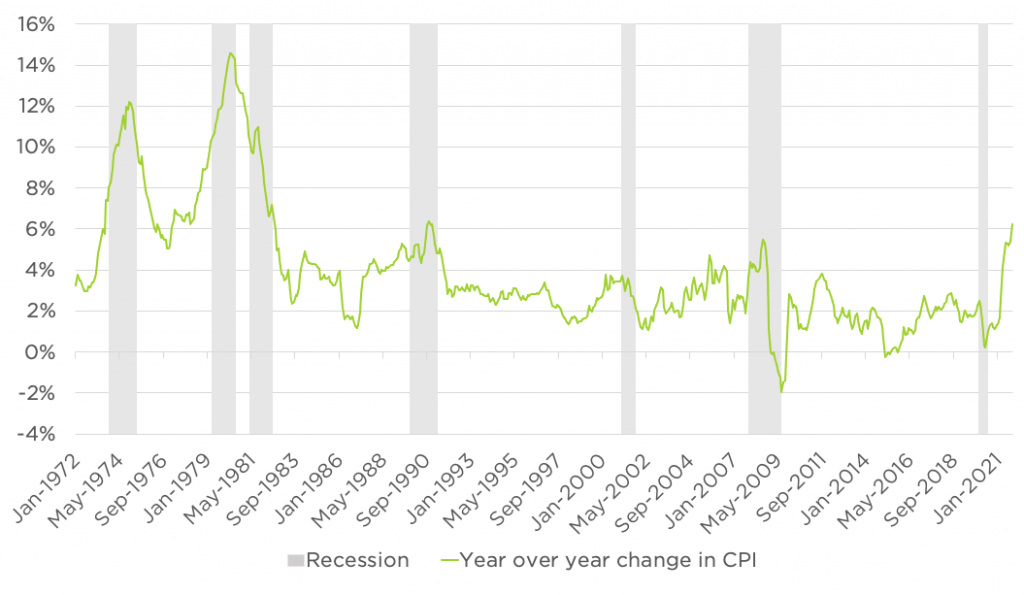
Each 5% CPI increase from the past 50 years has preceded an entirely unique environment, with little predictable reaction from any asset class. Reallocating among traditional assets in response to inflation spikes, then, is unlikely to consistently help. Instead, investors should, as usual, mostly stick with long-run strategic allocations. To illustrate the point, let’s take a quick look at the past 50 years in inflation history to evaluate each CPI spike and the investment environment that followed.
1970s: The Inflationary Decade
Inflation crossed the 5% year-over-year threshold in April 1972, then stayed well above that level through an entire decade, compounding at an annual rate of 8.6%. That’s a lot of inflation! Below are the forward 1-, 5-, and 10-year returns across traditional asset classes during the 1972-1982 period.
Asset Class Returns Starting in April 1972
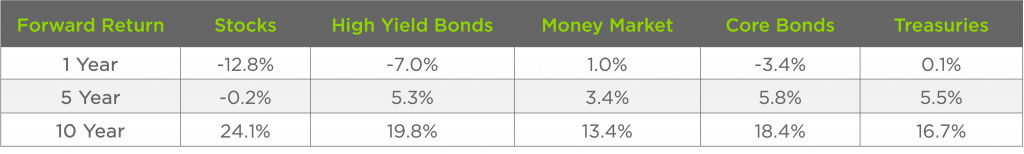
Cash had above-average performance in the one-year period following inflation’s 1972 rise. Over the longer term, however, stocks, bonds and high yield out-earned cash. Returns to holding cash in the 1970s, at 13.4% annually, were much higher than anything most investors would expect today. (Keep in mind that inflation was also unlike anything most U.S. investors have experienced lately.) Over the long term, cash remained a laggard.
April 1989 – February 1991: The Two-Year Flirtation
In the angsty early 1990s, inflation did show some sharp increases, but the ensuing years saw reversion toward a more moderate environment. Year-over-year inflation grew faster than 5% for three separate periods from 1989 to 1991.
- April – July 1989
- January – March 1990
- August 1990 – February 1991
In the decade that followed, inflation grew at a compounded annual rate of around 3%. These brief brushes with high inflation did not lead to a runaway decade like the 1970s.
Asset Class Returns Starting in April 1989
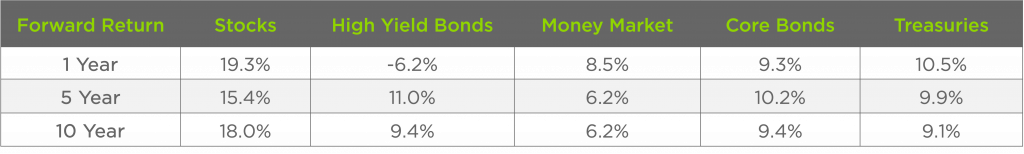
In this instance, cash provided reasonable short-term returns as well as stability in the year following the initial CPI jump. Longer run returns to cash were, as expected, behind those of the other asset classes.
July – August 2008: Surprise! It’s Actually the Great Recession
For 62 days in the summer of 2008, inflation crossed our 5% year-over-year threshold as oil prices jumped to nearly $140 a barrel. After that, CPI growth soon fell back below 5%, and many investors began to focus on the Great Financial Crisis and its aftermath. Inflation compounded at a below-target 10-year rate of 1.4% for the following decade.
Asset Class Returns Starting in April 2008
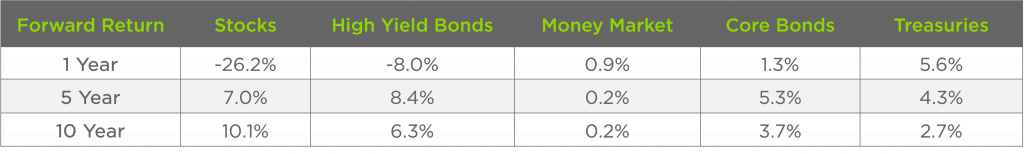
In the post-2008 environment, cash delivered paltry returns, and while the stock market crash and accompanying economic seizure caused a lot of major problems, traditional asset class returns eventually fell into line with history (albeit with a smaller inflation premium.)
History tells us, then, that a spike in inflation above 5% can portend:
- Rampant inflation (1970s)
- Steady, target rate inflation (1990s)
- A deep recession (2008)
The lesson is that investors can easily get wrong-footed after inflationary spikes. In-the-moment decisions stand a good chance of doing more harm than good – it’s too hard to tell what kind of environment might emerge. And long-run asset class returns tend to follow the classic risk-reward tradeoff, even after inflationary spikes.
Defensive Alternatives’ Potential Role
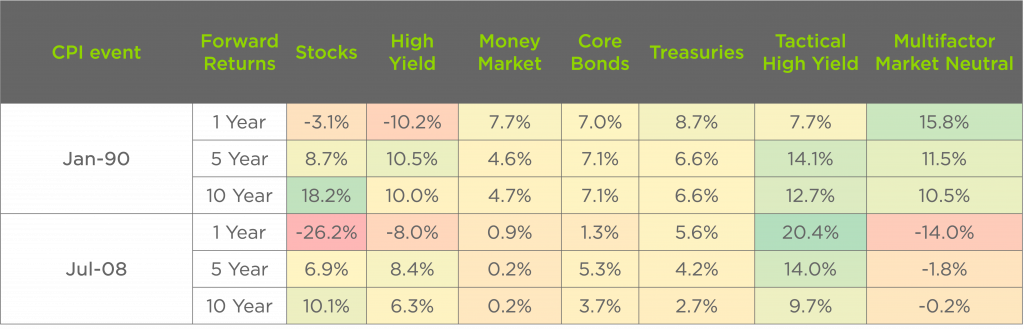
Although we don’t consider it wise to overweight cash or overhaul strategic allocations after inflationary spikes, we do believe alternatives can create long-term diversification benefits. To see what role defensive alternatives might have played in such environments, we tracked historical returns to two strategies for the 1990 and 2008 CPI events:
- A tactical high yield strategy that trend-follows high yield credit using a binary 200 day moving average signal
- A multifactor market neutral portfolio that equally weights exposures to value, profitability, and momentum factors
In both 1990 and 2008, at least one of the alternative strategies was a top performer among all asset classes on a forward-looking basis. (Decade-long performance for stocks in the 1990s did come in ahead of the alternatives.)
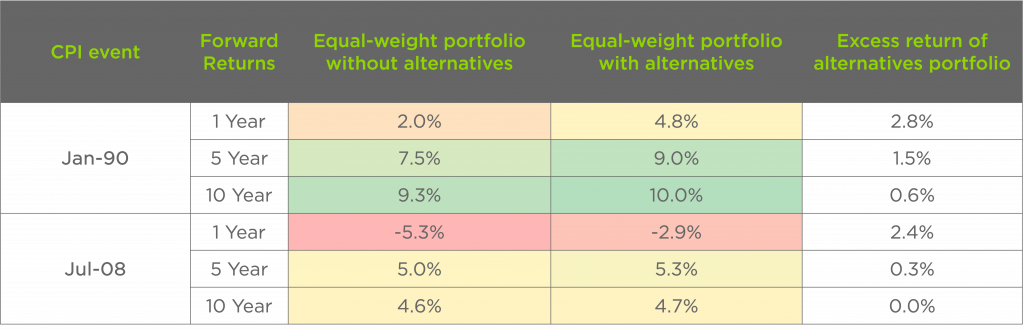
Alternatives’ collective diversification benefit following these inflationary events can be seen if you compare an equal weighted portfolio of our five traditional asset classes with an equal weighted portfolio of the five traditional asset classes, plus the two alternative strategies. Across all time horizons, including a multifactor equity strategy and a tactical high yield strategy buffered traditional portfolios against short-term disruptions following inflationary spikes, and long-run returns were also improved.
Set a strategic allocation and stick with it
The recent CPI spike has drawn a great deal of attention, and many investors may be tempted to take dramatic action in response. History tells us a 5% spike in inflation can lead to just about the broadest range of outcomes you can think of – runaway inflation, low/”normal” inflation, or a big economic contraction. Because of this variability, an inflationary spike like the one we’ve seen lately is probably best interpreted as a “brace yourself” indicator, but not cause for major portfolio adjustments. Investors should consider whether low-correlation defensive alternatives can provide some potential buffer against market shocks, then decide whether to include an alternatives sleeve within a long-term allocation plan.