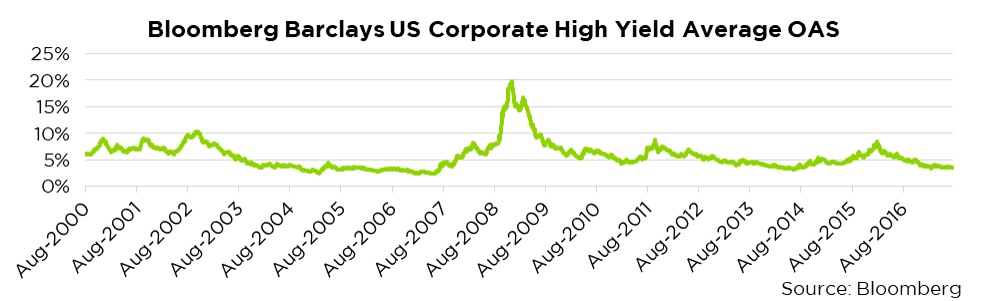
Counterpoint Tactical Income investors have lately raised concerns about fundamental valuations in high yield corporate credit. These concerns are understandable: High yield option adjusted spreads, which estimate the return investors demand in exchange for taking on credit risk, are tracking near 10-year lows as the 10-year anniversary of the Great Financial Crisis stirs painful memories. Counterpoint Tactical Income, which uses a quantitative model to switch between high yield or cash and short-dated treasuries, is currently invested in high yield.
Investors are rightly questioning the Fund’s risk-on posture during this exuberant embrace of credit risk. Why not wait until high yield gets cheaper, offering a greater reward than what’s on the table right now? This question is essentially about timing the market. Our response: Market timing is difficult, and the intuitive answer amid rising asset prices often is the wrong one.
First, we refer to the commonly held view in academic and professional finance that timing short-term movements in asset prices is, if not entirely futile, a very complicated proposition. If this is true, then a single fundamental metric such as option-adjusted spread might not provide sufficient basis for a risk-off exit from high yield. After all, markets are efficient, and they should offer rewards to compensate for the additional risk.
Stepping beyond theory, we looked at Counterpoint Tactical Income’s trend-following strategy in the context of different credit conditions. To a reasonable approximation, we found that risk-reward can be favorable even when credit spreads appear narrow and high yield looks expensive. On the flip side of the coin, waiting for a pullback can cause investors to miss out on statistically favorable short-term income-earning opportunities.
Let’s start by looking at some basic elements of a generalized trend following model. The following chart shows a hypothetical asset that delivers a steady, zero-risk 6% total return per year. We also mapped the trailing 200-day simple moving average of this hypothetical asset. The 6% target return is reflective of recent yield levels in high yield during non-crisis times. It is also a nice round number.
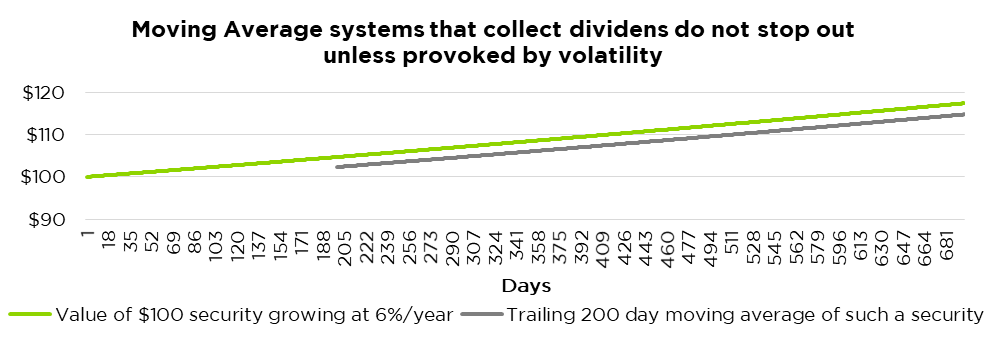
The 200-day moving average represents a popular number of trading days often used in trend following models. It must be noted that while the Counterpoint Tactical Income Fund uses a moving average approach, it does not use a simple 200-day moving average. Because there is no variation in the 6% return for our hypothetical asset, the 200-day moving average simply tracks the asset returns perfectly, with a 200-day lag.
Let’s now assume that we are using these two data points – the cumulative asset returns and the 200-day moving average – to create a trend following strategy. If the asset price drops below the 200-day total return moving average, we detect a downtrend and sell. Under conditions of a constant 6% total return, however, the 200-day moving average stop loss is constant at just over 2.25% below the asset price. In this hypothetical world, there is only one decision – own the asset and never sell.
Unfortunately, the real world does not offer us a zero-volatility 6% return. Instead, returns to risky assets such as high yield corporate bonds vary over time, creating a more complicated decision set for trend followers. Nevertheless, Amid an average expected 6% return, we can typically expect the average stop-loss to be around 2.25% below the asset price.
With this framework in mind, we assumed that an adverse event that would trigger a 2.25% stop-loss corresponds to approximately a 45 basis point increase in the option-adjusted spread. We arrived at 45 basis points by dividing the 2.25% stop loss by 5, because the broad high yield market has a typical bond maturity of approximately 5 years. A 45 basis point adverse move in the average spread comes out to an adverse 2.25% (5 times 0.45%) price move in high yield bonds with this back of the envelope approach. It’s an imperfect calculation, but provides a frame of reference for our expectations about risk off signals in the high yield credit market.
Looking at the high yield credit market from late 2000 to today, the following chart answers the question, “Given our observation of historic high yield credit spreads, what percentage of the time did we experience a stop-loss in the following four months?” Four months is chosen because it represents the time it would take to earn coupon income representing approximately the size of the 2.25% stop. For reference, the high yield credit spread is currently at 4.01% for all cash bonds.
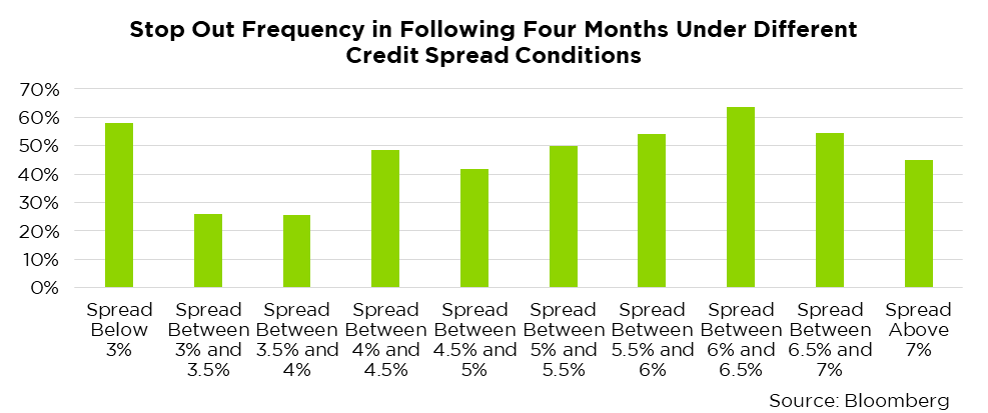
The result is surprising: An extreme embrace of credit risk shown by an option adjusted credit spread below 3% does correspond to an expected stop loss the majority of the time during the following 4 months. However, in slightly less extreme conditions such as the ones we are experiencing now, not only is a stop loss signal improbable, it is less probable than in situations where high yield bonds are “cheaper,” or at higher yield levels. Surprisingly, investors can expect fewer sell signals when bonds are relatively pricey and credit spreads are in the 3% to 4% range. Here we see academic theory playing out in practice: Prices don’t necessarily move according to intuition. Expensive assets can stay expensive in the short term.
We also looked at the cumulative probability of an adverse move in high yield bond total returns in the following 4 months, given the same observations about the option-adjusted spread.
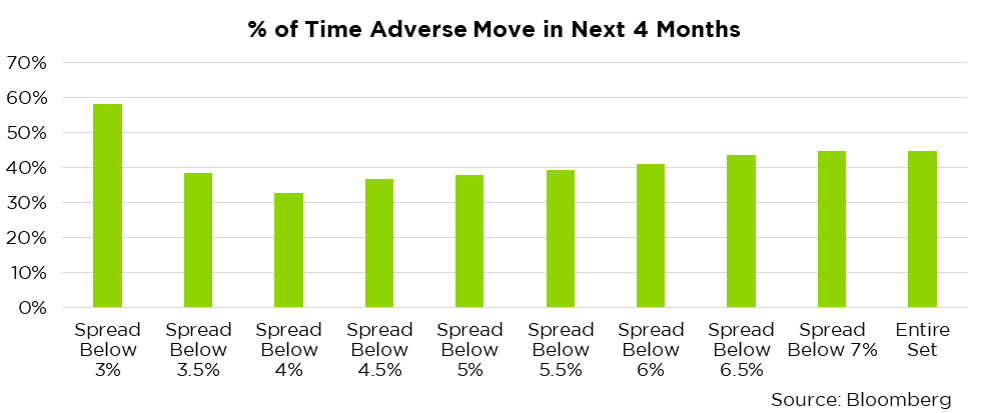
Using a trader’s risk-reward framework, we see again that under conditions similar to what we’re experiencing today, probabilities favor a risk-on position. A bond yield of around 6% corresponds to a roughly 2% four-month yield (four months is one-third of a year). Even when the reward looks relatively thin, investors can expect to more than break even. Historically, when the option-adjusted spread was between 3% and 3.5%, the realized frequency of a triggered stop loss was only 26%. The remaining 74% of the time, high yield bonds earned enough income to prevent such an event. The expected value of staying risk-on even amid high prices and low credit spreads is positive. At these levels, statistical reward outweighs statistical risk.
In extreme situations when credit spreads are below 3%, fundamental investors may be rewarded for their caution, as the frequency of stop loss triggers in the following four months rises above 60%. It’s worth noting, however, that such situations are relatively rare, about 6.3% of the time over the 2000-2017 period.
Investors should not ignore market fundamentals when making decisions. However, they should be cautious about judging the risk-reward in high yield according to an intuitive look at fundamental metrics such as the option-adjusted spread. As we see here, valuation levels that can look pricey to a casual observer actually show a statistically favorable short-term risk reward profile.
In our view, appropriate risk management in the high yield asset class involves adherence to a trend following model that has historically managed downside while earning reasonable returns. At current levels, we see evidence favoring our risk-on posture, as well as a basis to be skeptical of intuitive answers to questions about fundamental valuations in high yield. When a statistically reasonable framework is in place, it can make sense to trust the framework, and we are applying that philosophy to the management approach of the Counterpoint Tactical Income Fund.
Disclosures
The Bloomberg Barclays US Corporate High Yield Average Option-Adjusted Spreads (OAS) are the calculated spreads between a computed OAS index of all bonds in a given rating category and a spot Treasury curve. An OAS index is constructed using each constituent bond’s OAS, weighted by market capitalization. The Bloomberg Barclays US Corporate High Yield Average OAS uses an index of bonds that are below investment grade (those rated BB or below).
There is no assurance the Fund Advisor’s opinions of risk management will come to pass and past performance is no assurance of future results. Of course, there is no guarantee that any investment strategy will achieve its objectives, generate profits or avoid losses. Mutual Funds involve risk including the possible loss of principal. The use of leverage by the Fund or an Underlying Fund, such as borrowing money to purchase securities or the use of derivatives, will indirectly cause the Fund to incur additional expenses and magnify the Fund’s gains or losses. Derivative instruments involve risks different from, or possibly greater than, the risks associated with investing directly in securities and other traditional investments. There is a risk that issuers and counterparties will not make payments on securities and other investments held by the Fund, resulting in losses to the Fund.
Investors should carefully consider the investment objectives, risks, charges and expenses of the Counterpoint Tactical Income Fund. This and other important information about the Fund is contained in the prospectus, which can be obtained at www.counterpointfunds.com or by calling 844-273-8637. The prospectus should be read carefully before investing. The Counterpoint Tactical Income Fund is distributed by Northern Lights Distributors, LLC member FINRA/SIPC.
4736-NLD-8/17/2017