Year-ahead commentary is challenging for us: We don’t have a crystal ball, and we believe predictions contribute more to investment mistakes than outperformance. But the New Year does...
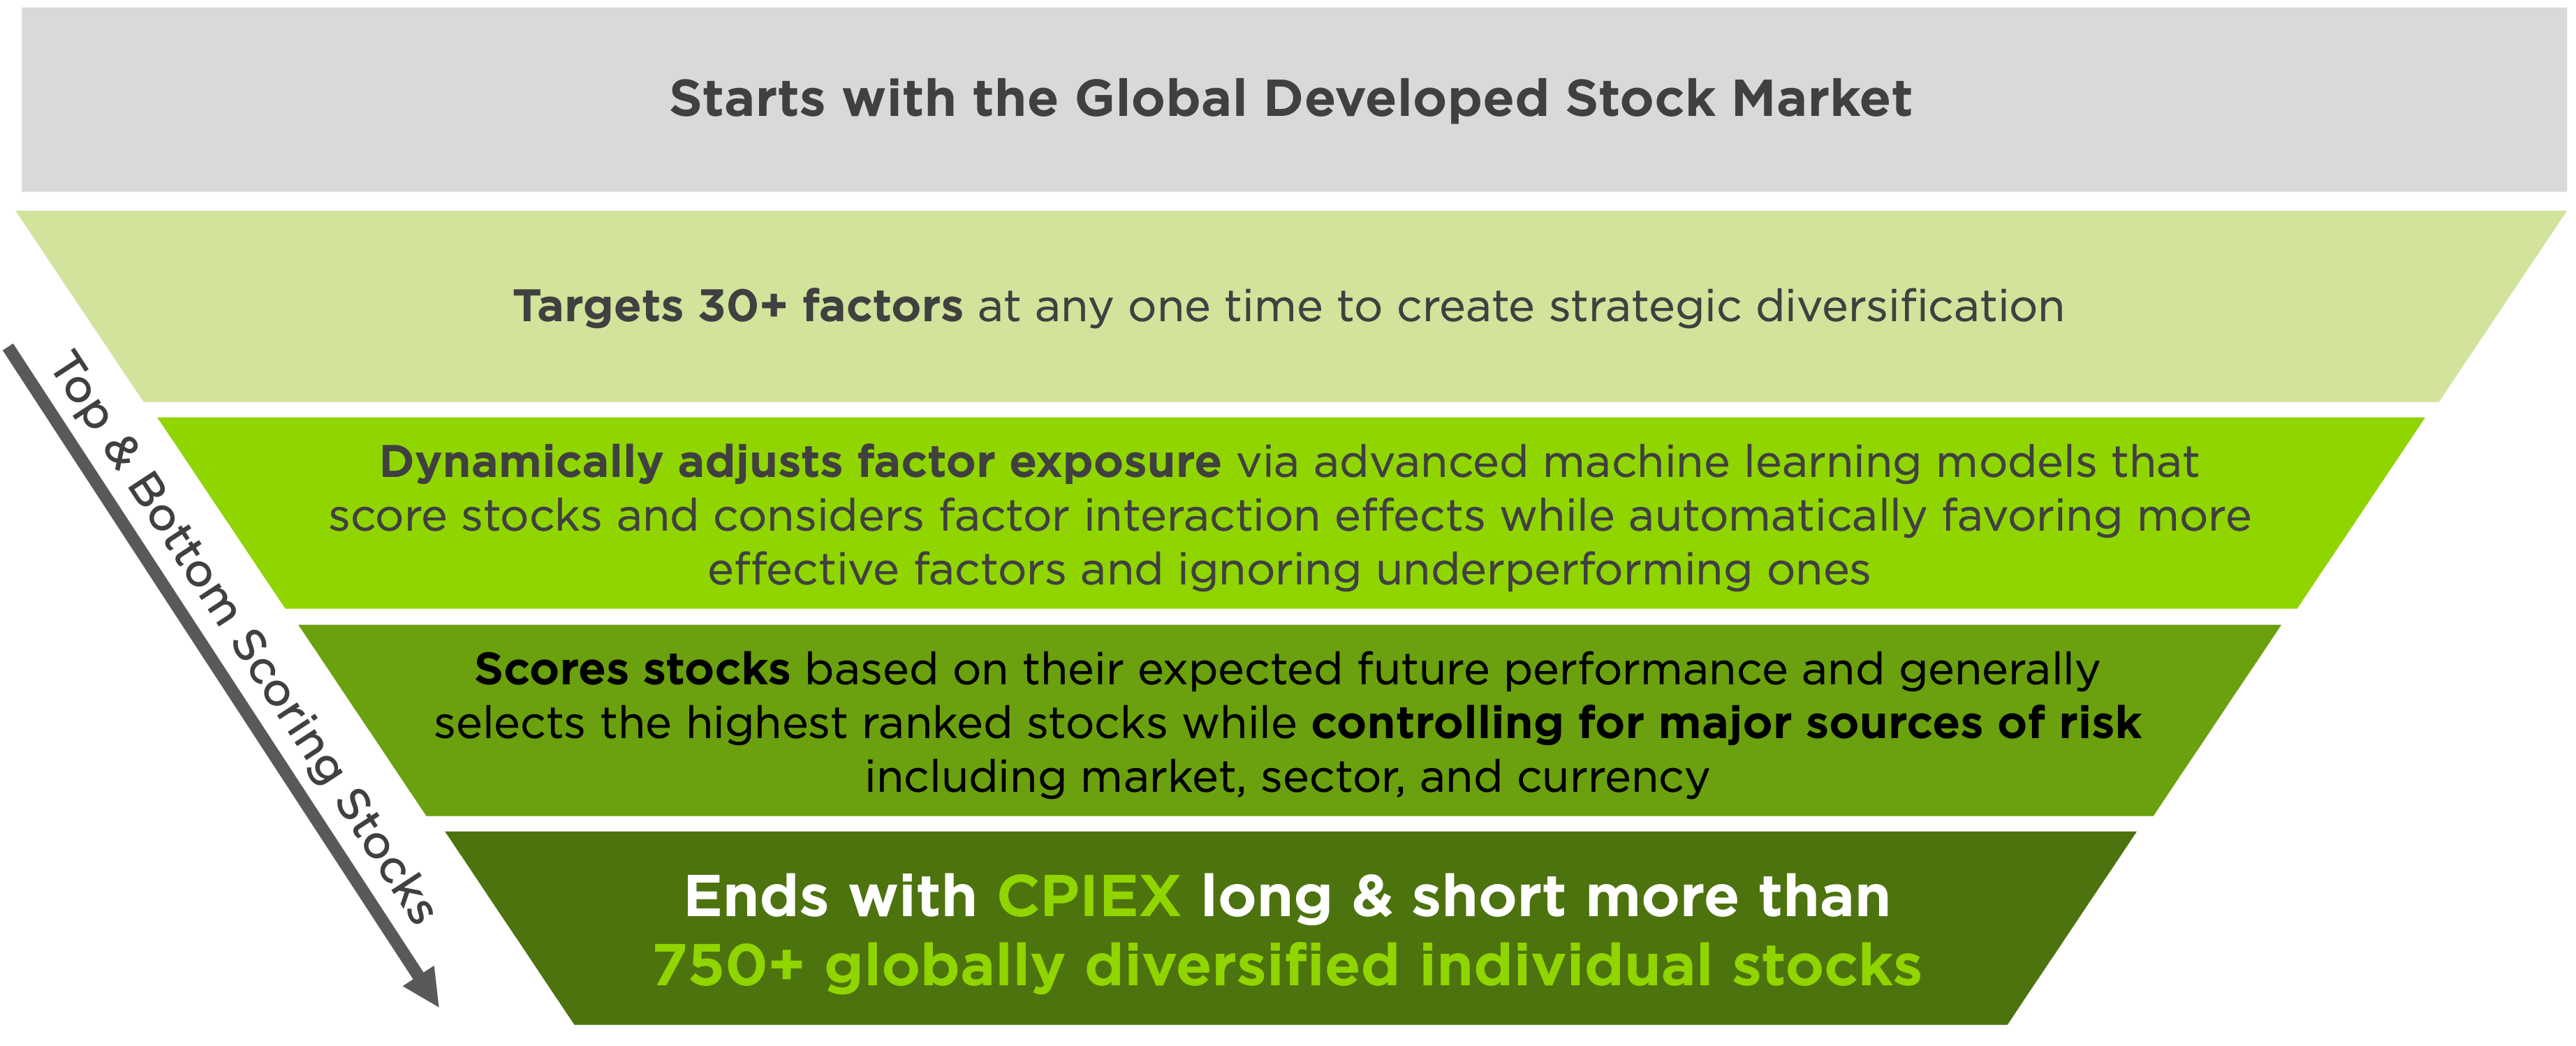
READ MORECPIEX’s stock-selection process produces a market-neutral portfolio with 750+ globally diversified individual holdings from all market capitalization segments.
The market neutral portfolio targets an annual standard deviation of 6-7%, which is less than half the market average historically.
The stock-selection model is optimized to reduce major sources of risk, such as market, sector, and currency risk, and enables long and short exposure of approximately 100-130% respectively.
The Fund employs a long-short strategy to identify mispricing opportunities of securities, which are monetized when mispricing is corrected, offering sources of return that can be uncorrelated to market movements.
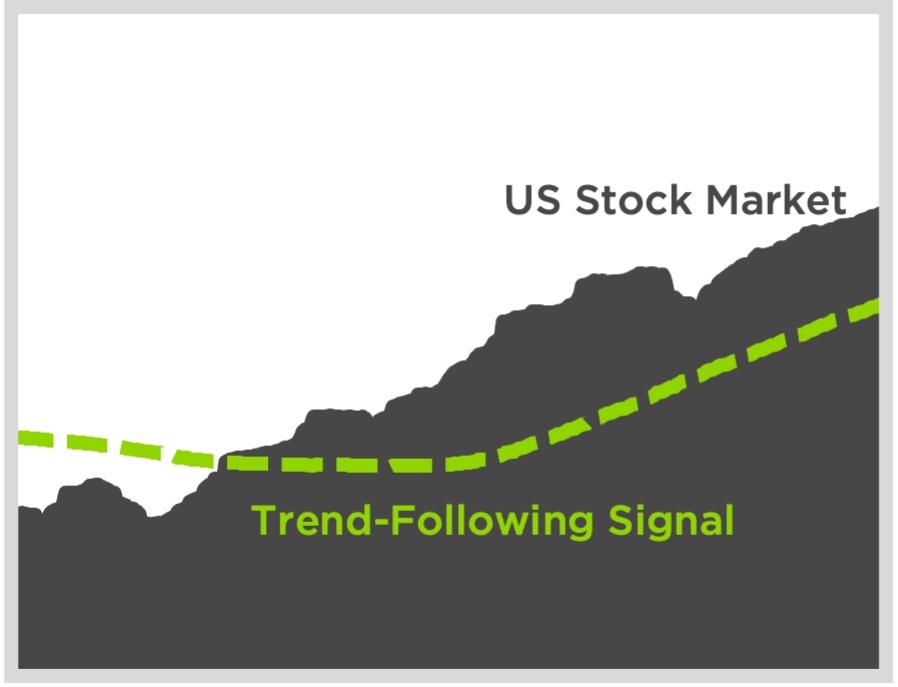
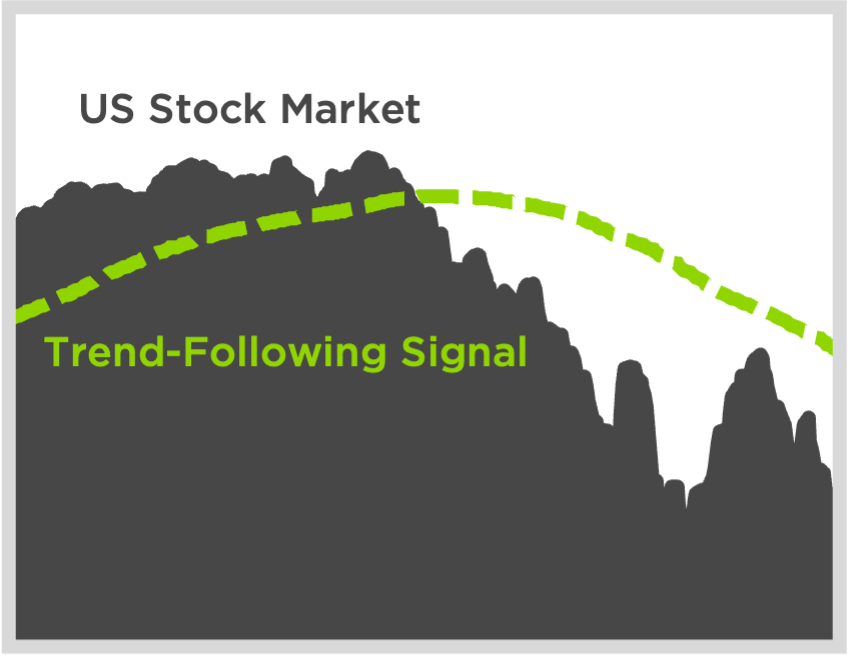
CPIEX seeks capital appreciation and capital preservation by investing in a global long-short portfolio with a tactical US stock market overlay that is risk-on2 during market upswings and risk-off2 during extended market downswings.

The Fund seeks to avoid extended periods of downside volatility in the US Stock Market by using an algorithmic
tactical model.


For illustrative purposes only. 1 The Advisor varies Fund’s equity exposure using a proprietary tactical model of market returns. When the tactical model forecasts lower market returns, the Fund goes “risk-off” targeting a market-neutral (zero beta) allocation to stocks with a gross equity exposure (long positions plus short positions) of at least 80%. When the tactical model forecasts higher market returns, the Fund goes “risk-on” targeting 80% exposure (0.8 beta) to the US Stock Market by holding futures, swaps or ETFs. There is no guarantee that any investment strategy will achieve its objectives, generate profits or avoid losses. Additional definitions can be found after disclosures.
The Fund uses a blend of multiple quantitative machine learning models and advanced artificial intelligence techniques to most optimally score and select the highest ranked stocks.

There is no guarantee that any investment strategy will achieve its objectives, generate profits or avoid losses.
The Counterpoint Tactical Equity Fund seeks to provide long exposure to stocks with the highest predicted return, and short exposure to stocks with the lowest predicted return, where factor exposures are dynamic depending on factor interaction effects and market conditions.
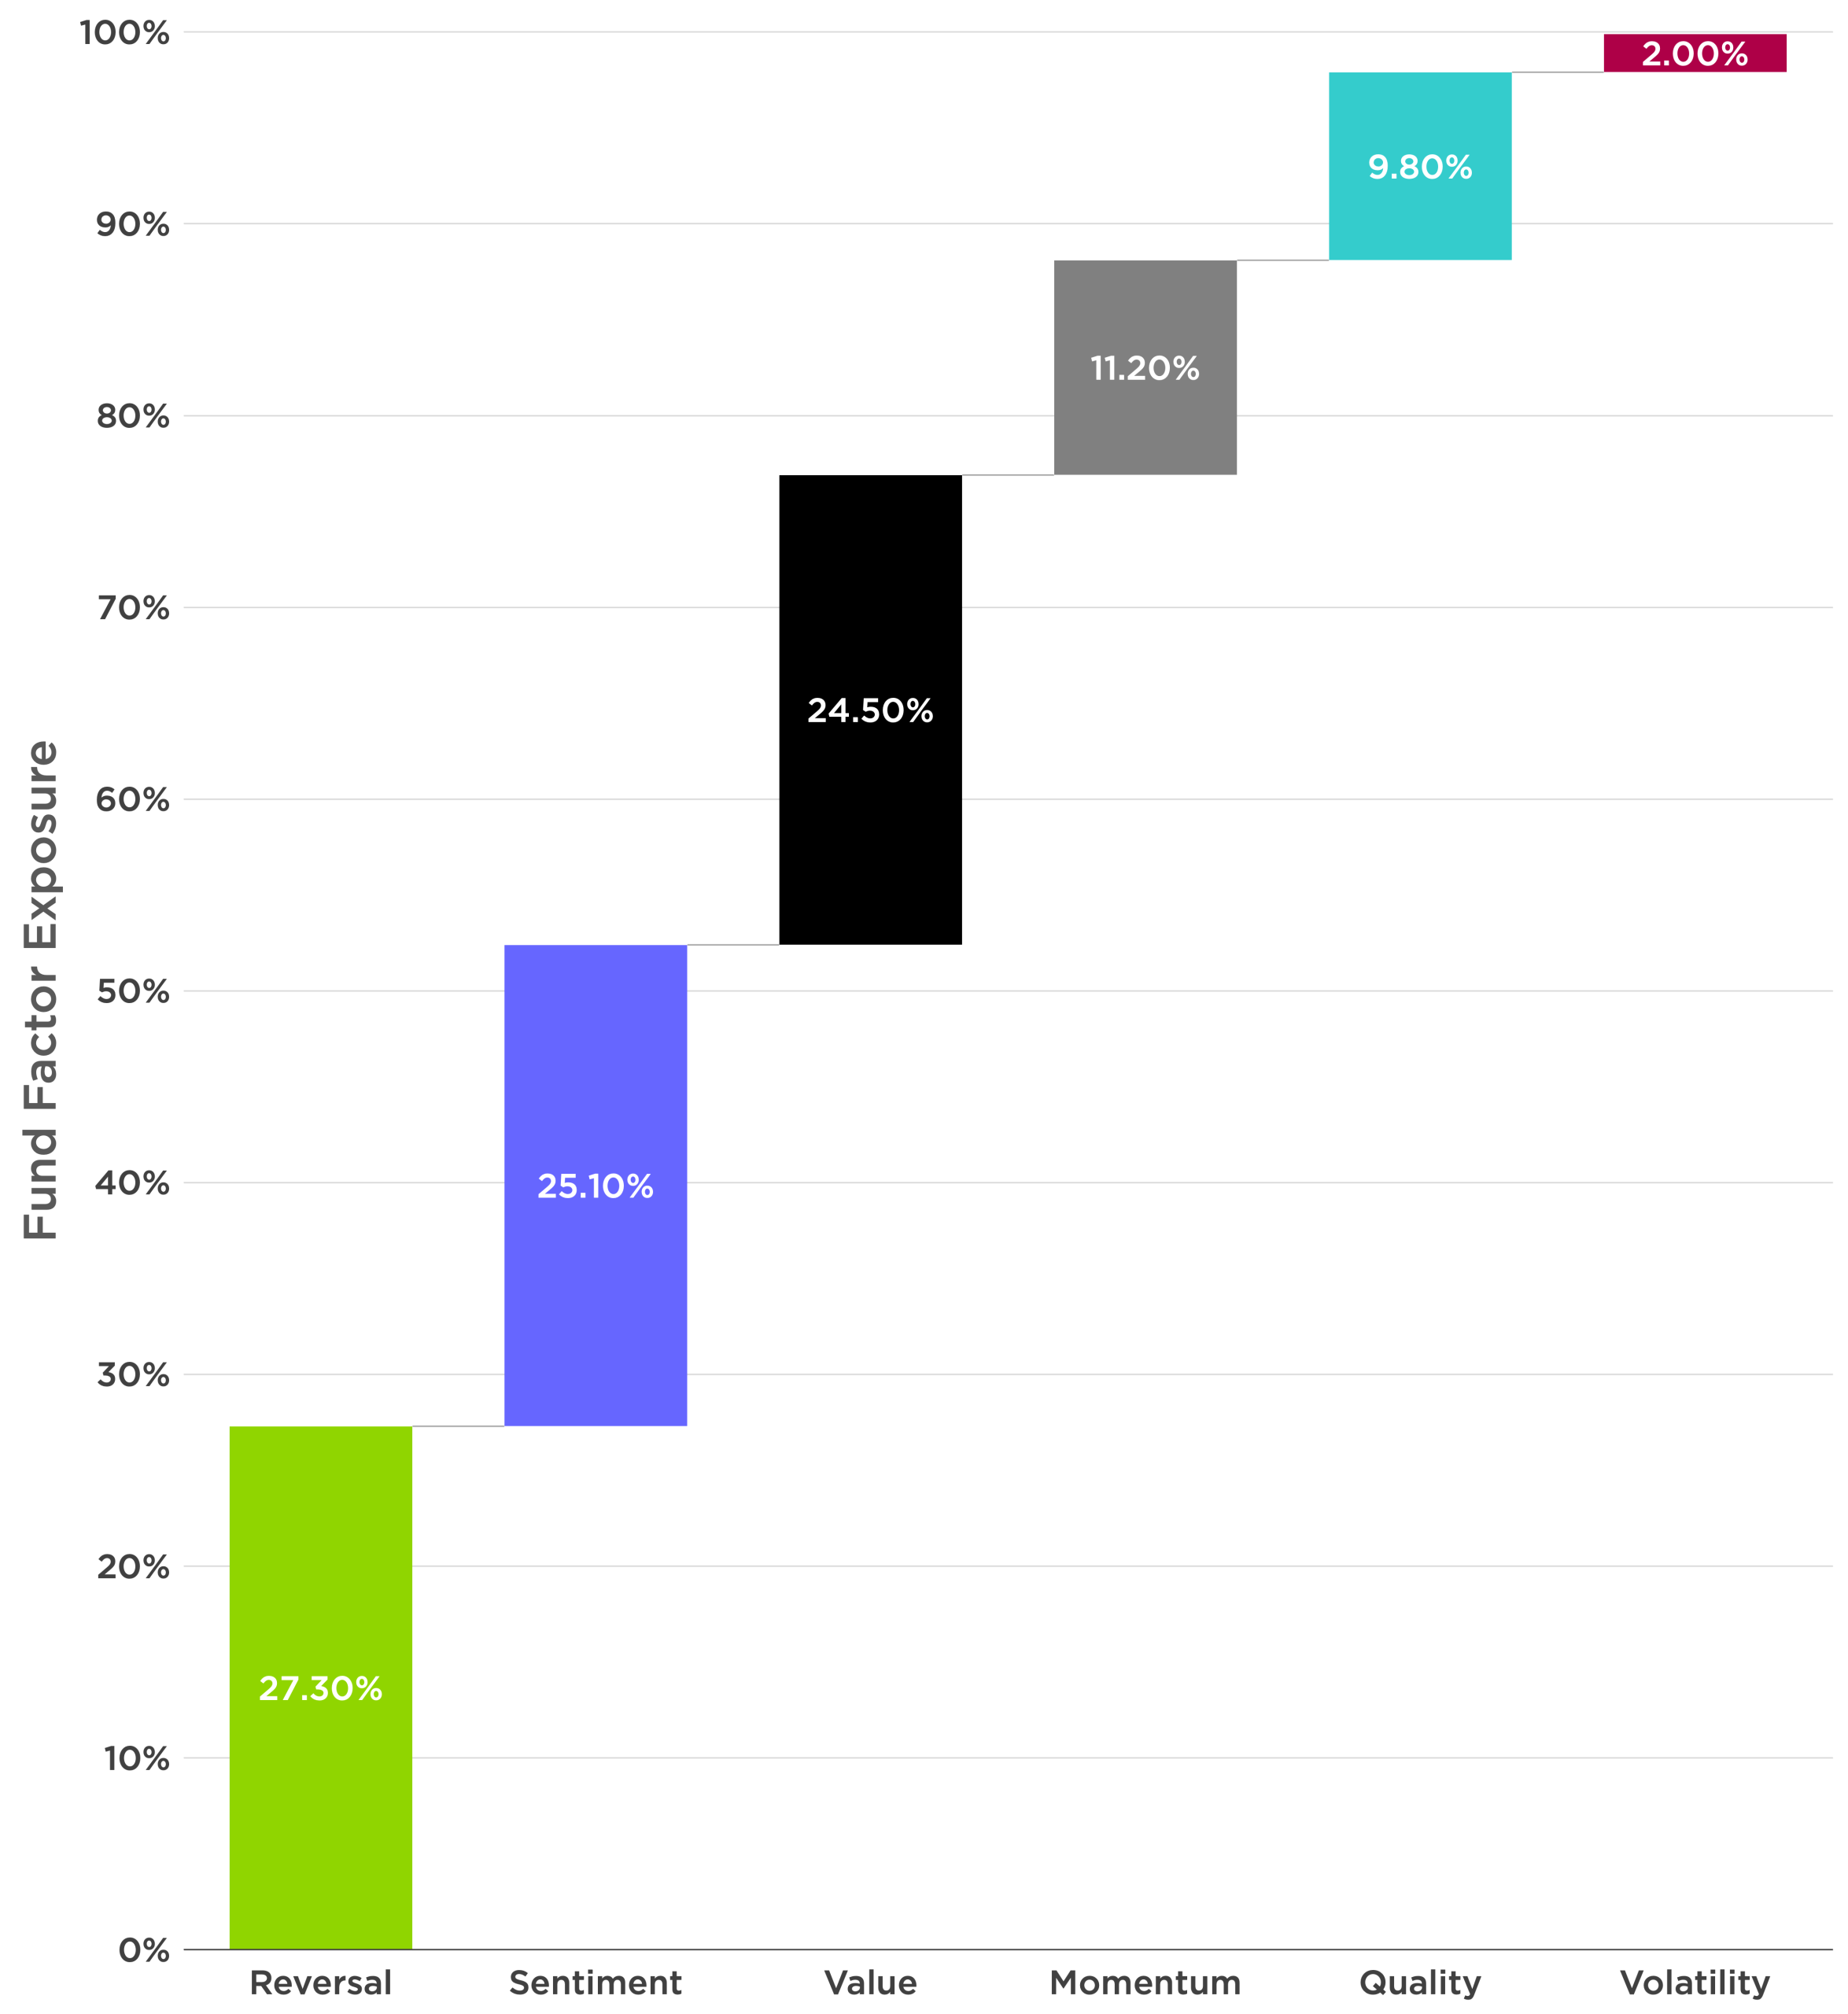
The chart below displays the current total factor weighting for CPIEX as of the last rebalance. This attribution shows expected factor exposure weighting relative to a global market neutral portfolio.


Factor exposures as of December 31, 2025. The chart displays the factor exposure of the stocks invested long and short by the fund as of the last rebalance. Positive factor weightings must sum to 100%. Factor attributions that subtract from total factor exposure estimate, often indicate the model takes negative exposure to certain factors because some other factor has positive expectations that exceed the negative contribution. i.e., Volatility factor usually includes lower volatility stocks when the the attribution is positive, and higher volatility stocks when the attribution is negative. Likewise, it would show High quality when positive, low quality when negative. It does not show actual investment returns or performance of the fund. Future performance is unknown. Additional definitions can be found after disclosures.
Year-ahead commentary is challenging for us: We don’t have a crystal ball, and we believe predictions contribute more to investment mistakes than outperformance. But the New Year does...
READ MOREOne of the most common questions we hear from advisors and their clients is: How does A.I. actually work in quantitative investing? While the jargon around machine learning...
READ MORESince the market bottomed on April 8, 2025, investors have witnessed a highly speculative, “pro-junk” environment. Stocks with weak fundamentals—richly valued, unprofitable companies often fueled by hype—have surged...
READ MORE| As of February 12, 2026 | As of December 31, 2025 | |||||||||
|---|---|---|---|---|---|---|---|---|---|---|
| Return Since Fund Inception (Annualized) | Year to Date | 1 Year Return | Standard Deviation (Annualized)“ | Return Since Fund Inception (Annualized) | Year To Date | 1 Year Return | 3 Year Return (Annualized) | 5 Year Return (Annualized) | 10 Year Return (Annualized) | |
| CPIEX | 6.73% | 1.43% | 5.72% | 12.07% | 6.66% | 10.17% | 10.17% | 17.25% | 22.73% | 6.87% |
| CPAEX Without Sales Load | 6.46% | 1.42% | 5.44% | 12.07% | 6.39% | 9.87% | 9.87% | 16.94% | 22.41% | 6.61% |
| CPAEX With Sales Load (5.75%) | 5.84% | -4.40% | -0.61% | 12.07% | 5.77% | 3.55% | 3.55% | 14.65% | 5.98% | 6.61% |
| CPCEX | 5.66% | 1.29% | 4.66% | 12.07% | 5.59% | 9.10% | 9.10% | 16.08% | 21.51% | 5.81% |
| Blended Index | 8.39% | 0.17% | 9.32% | 12.16% | 8.48% | 11.05% | 11.05% | 13.82% | 9.00% | 8.64% |
The performance data displayed here represents past performance, which is no guarantee of future results. Current performance may be lower or higher than the performance data quoted. The investment return and principal value of an investment will fluctuate so that investor’s shares, when redeemed, may be worth more or less than their original cost. A shares (CPAEX) have a Front-End Sales Charge (commission or “load”) of 5.75%, with lower rates for accounts over $25,000, and 12b-1 distribution fee of 0.25% per year. For performance information current to the most recent month-end, please call toll-free 844-273-8637.
The Counterpoint Tactical Equity Fund seeks to provide capital appreciation while managing downside risk. The Fund invests in individual stocks that have exposure to multiple market anomalies, while using a tactical model to dynamically adjust portfolio risk.
The Counterpoint Tactical Equity Fund Blended Index is a composite of 50% of the S&P 500 Total Return Index and 50% of the Bloomberg 1-3 Month U.S. Treasury Bill Index. Index returns assume reinvestment of dividends. Investors may not invest in the Index directly. Unlike the Fund’s returns, the Index does not reflect any fees or expenses.
| Ticker | CPAEX | CPCEX | CPIEX |
|---|---|---|---|
| CUSIP | 66538G429 | 66538G411 | 66538G395 |
| Share Class | Class A | Class C | Institutional |
| Minimum Investment | $5,000 | $5,000 | $100,000 |
| Minimum IRA Investment | $1,000 | $1,000 | $100,000 |
| Management Fee | 1.25% | 1.25% | 1.25% |
| Other Fund Expenses | 0.32% | 0.32% | 0.32% |
| Acquired Fund Fees and Expenses | 0.10% | 0.10% | 0.10% |
| 12b-1 Distribution & Marketing | 0.25% | 1.00% | None |
| Total Annual Operating Fees | 1.92% | 2.67% | 1.67% |
| Expense Recapture | 0.11% | 0.11% | 0.11% |
| Total Annual Fund Operating Expenses After Expense Recapture | 2.03% | 2.78% | 1.78% |
| Fund Inception Date | November 30, 2015 |
The Fund’s investment adviser has contractually agreed to reduce its fees and/or absorb expenses of the Fund, at least until February 1, 2026 to ensure that the net annual fund operating expenses exclusive of Acquired Fund Expenses will not exceed 2.00%, 2.75%, and 1.75% attributable to Class A, Class C, and Class I shares, subject to possible recoupment from the Fund in future years.
| Top Ten Holdings – as of January 30, 2026 | |
|---|---|
| SPDR S&P 500 ETF TRUST | 44.12% |
| Fidelity Treasury Portfolio Class I | 30.64% |
| Counterpoint Quantitative Equity ETF | 10.98% |
| iShares Core S&P 500 ETF USD Class | 10.09% |
| MSCPIN1 INDEX | 9.01% |
| United States Treasury Bill 0%, Due 06/04/2026 | 8.65% |
| US DOLLAR FUTURE | 5.70% |
| MSCPUS1 INDEX | 5.62% |
| United States Treasury Bill 0%, Due 09/03/2026 | 5.14% |
| S&P500 EMINI OPTN Mar26P 6700 | 0.51% |
Swap Basket Holdings as of 12/31/2025
Swap Basket Holdings as of 9/30/2025
Swap Basket Holdings as of 6/30/2025
Swap Basket Holdings as of 3/31/2025
Swap Basket Holdings as of 12/31/2024
Swap Basket Holdings as of 9/30/2024
Swap Basket Holdings as of 6/28/2024
Swap Basket Holdings as of 3/29/2024
Swap Basket Holdings as of 12/29/2023
Swap Basket Holdings as of 9/29/2023
Swap Basket Holdings as of 6/30/2023
Swap Basket Holdings as of 3/31/2023
Swap Basket Holdings as of 12/30/2022
Swap Basket Holdings as of 9/30/2022
Swap Basket Holdings as of 6/30/2022
Swap Basket Holdings as of 3/31/2022
Swap Basket Holdings as of 12/31/2021
Swap Basket Holdings as of 9/30/2021
Portfolio holdings are subject to change, vary over time and should not be considered a recommendation to buy any individual security.
| Dividend Rate | Ex Date | Fund Share Class | Long Term Gain | Pay Date | Record Date | Short Term Gain |
|---|---|---|---|---|---|---|
| 0.0844 | 12/18/2025 | 5013-Counterpoint Tactical Equity A | 1.0582 | 12/19/2025 | 12/17/2025 | 0.0771 |
| 0.1474 | 12/18/2025 | 5015-Counterpoint Tactical Equity I | 1.0582 | 12/19/2025 | 12/17/2025 | 0.0771 |
| 0 | 12/18/2025 | 5014-Counterpoint Tactical Equity C | 1.0582 | 12/19/2025 | 12/17/2025 | 0.0771 |
| 0.0174 | 12/30/2024 | 5015-Counterpoint Tactical Equity I | N/A | 12/31/2024 | 12/27/2024 | N/A |
| 0.0096 | 12/30/2024 | 5014-Counterpoint Tactical Equity C | N/A | 12/31/2024 | 12/27/2024 | N/A |
| 0.0153 | 12/30/2024 | 5013-Counterpoint Tactical Equity A | N/A | 12/31/2024 | 12/27/2024 | N/A |
| 0 | 12/18/2024 | 5015-Counterpoint Tactical Equity I | 0.0621 | 12/19/2024 | 12/17/2024 | 0.3978 |
| 0 | 12/18/2024 | 5013-Counterpoint Tactical Equity A | 0.0621 | 12/19/2024 | 12/17/2024 | 0.3978 |
| 0 | 12/18/2024 | 5014-Counterpoint Tactical Equity C | 0.0621 | 12/19/2024 | 12/17/2024 | 0.3978 |
| 0.0184 | 12/28/2023 | 5015-Counterpoint Tactical Equity I | N/A | 12/29/2023 | 12/27/2023 | N/A |
| 0.0109 | 12/28/2023 | 5014-Counterpoint Tactical Equity C | N/A | 12/29/2023 | 12/27/2023 | N/A |
| 0.0163 | 12/28/2023 | 5013-Counterpoint Tactical Equity A | N/A | 12/29/2023 | 12/27/2023 | N/A |
| 0.3443 | 12/18/2023 | 5013-Counterpoint Tactical Equity A | N/A | 12/19/2023 | 12/15/2023 | N/A |
| 0.382 | 12/18/2023 | 5015-Counterpoint Tactical Equity I | N/A | 12/19/2023 | 12/15/2023 | N/A |
| 0.2298 | 12/18/2023 | 5014-Counterpoint Tactical Equity C | N/A | 12/19/2023 | 12/15/2023 | N/A |
| 0 | 12/19/2022 | 5014-Counterpoint Tactical Equity C | N/A | 12/20/2022 | 12/16/2022 | 0.4829 |
| 0 | 12/19/2022 | 5015-Counterpoint Tactical Equity I | N/A | 12/20/2022 | 12/16/2022 | 0.4829 |
| 0 | 12/19/2022 | 5013-Counterpoint Tactical Equity A | N/A | 12/20/2022 | 12/16/2022 | 0.4829 |
| N/A | 12/20/2018 | 5015-Counterpoint Tactical Equity I | 0.4907 | 12/20/2018 | 12/19/2018 | N/A |
| N/A | 12/20/2018 | 5014-Counterpoint Tactical Equity C | 0.4907 | 12/20/2018 | 12/19/2018 | N/A |
| N/A | 12/20/2018 | 5013-Counterpoint Tactical Equity A | 0.4907 | 12/20/2018 | 12/19/2018 | N/A |
| N/A | 12/21/2017 | 5015-Counterpoint Tactical Equity I | 0.9137 | 12/21/2017 | 12/20/2017 | N/A |
| N/A | 12/21/2017 | 5014-Counterpoint Tactical Equity C | 0.9137 | 12/21/2017 | 12/20/2017 | N/A |
| N/A | 12/21/2017 | 5013-Counterpoint Tactical Equity A | 0.9137 | 12/21/2017 | 12/20/2017 | N/A |
Mutual Funds involve risk including the possible loss of principal. The use of leverage by the Fund or an Underlying Fund, such as borrowing money to purchase securities or the use of derivatives, will indirectly cause the Fund to incur additional expenses and magnify the Fund’s gains or losses. Derivative instruments involve risks different from, or possibly greater than, the risks associated with investing directly in securities and other traditional investments. There is a risk that issuers and counterparties will not make payments on securities and other investments held by the Fund, resulting in losses to the Fund. Past performance is no guarantee of future results. There is no assurance the Fund will meet their stated objectives.
CPIEX’s Blended Index is a composite of 50% of the S&P 500 Total Return Index and 50% of the Bloomberg 1-3 Month U.S. Treasury Bill Index. Index returns assume reinvestment of dividends. Investors may not invest in the Index directly. Unlike the Fund’s returns, the Index does not reflect any fees or expenses.
The S&P 500 Total Return Index or Standard & Poor’s 500 Index, is a market-capitalization-weighted index of 500 leading publicly traded companies in the U.S.
CPIEX is “Risk-On” when equity markets are above Counterpoint’s proprietary price-based moving average, the model targets an 80% net long exposure to the US Stock Market by holding Futures, Swaps or ETFs in addition to earning the returns to its market-neutral portfolio.
CPIEX is “Risk-Off” when equity markets are below Counterpoint’s proprietary price-based moving average, the model sells any net long exposure to the US Stock Market and only earns returns from its market-neutral portfolio.
Return is the percentage change in the value of an investment, and/or cash flows which the investor receives from that investment, such as interest payments, coupons, cash dividends, stock dividends or the payoff from a derivative or structured product, over a specified time period.
Beta (β), or Market Beta, is a measure of the volatility—or systematic risk—of a security or portfolio compared to the market as a whole or index such as the Bloomberg Barclays US Aggregate Bond Index or S&P 500 Total Return Index. Beta effectively describes the activity of a security’s returns as it responds to swings in the market. A stock with a beta of 1.0 means its price activity correlates with the market.
Standard Deviation (Std Dev) measures the dispersion of returns relative to its mean to determine the volatility of an investment and is calculated as the square root of the variance by determining the deviation of daily returns relative to the mean.
Factors are persistent and well-documented characteristics/financial metrics that can help investors understand differences in expected return.
Positive (Factor) Exposure is the positive contribution of a given factor (directly) to the total return of the fund, regardless of long or short position, within a specified period.
Negative (Factor) Exposure is the negative contribution of a given factor (directly) to the total return of the fund within a specified period. The Fund’s selection model will occasionally take negative exposure to a factor (long or short) to prioritize the total return of the fund.
Sentiment reflects indicators of outlook such as revisions to analyst estimates of future earnings, share issuance changes, or measures of short interest and demand in the share lending market.
Momentum refers to the tendency of winning stocks to continue performing well in the near term. Momentum is categorized as a “persistence” factor i.e., it tends to benefit. from continued trends in markets.
Reversal measures when the direction of a price trend has changed, from going up to going down, or vice-versa.
Volatility (or Stability) measures underlying company risk, such as volatility or beta
Quality measures financial statement quality characteristics, i.e. the Profitability anomaly.
Value includes measures of company valuation such as price/sales ratio, and prices/earnings ratio.
20241120-4006678
We’ve received your request for the featured event collateral. A Counterpoint Funds team member will be in touch shortly.
Subscribe to stay up to date on and receive our monthly perspective.
We’ve received your meeting request and a Counterpoint Funds team member will be in touch shortly.
Subscribe to stay up to date on and receive our monthly perspective.
We’ve received your event registration request and will be in touch shortly.
Subscribe to stay up to date on Counterpoint Funds and receive our monthly perspective.
We have received your application and look forward to reviewing your qualifications for the role. If your application seems like a good fit, we will contact you to discuss next steps.
Thank you again for your application and interest in joining the Counterpoint team!
We’ve received your message. A Counterpoint Funds team member will contact you soon.
Subscribe to stay up to date and receive our monthly perspective.