Imagine you’re an active bond portfolio manager. Your investors hire you to outperform an index, and you do this by buying the best bonds you can find.
You’re probably very excited by recent news in your industry. Respected academics and successful quantitative managers are saying systematic strategies can “beat the index” in the bond market. If they’re right, you stand a chance of beating the index and pleasing your investors.
All of this sounds great, but we have some bad news for you. We think the ceiling for active managers trying to beat their benchmarks is very low. Unless the bond market is stressed, it’s hard to beat the index by picking individual bonds, simply because the difference between the average return of the 10% best and 10% worst performing bonds is so small.
A Good (Or Even Different) Bond Is Hard To Find
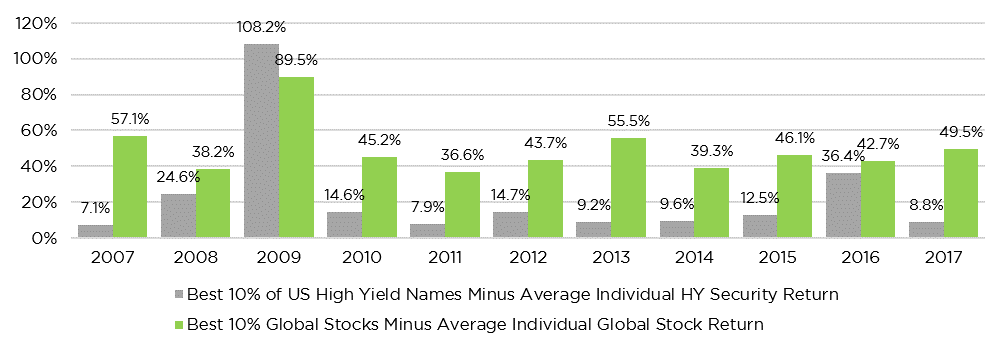
When grouping bonds by average return, good and bad bonds just aren’t different enough from one another. To put this into perspective, we ranked 12 month US high yield bond returns from best to worst for each of the past 10 years. Then we measured the difference in performance between the top 10% of high yield bonds and the average bond return within the index. For comparison, we show the same measure for individual global stocks is highlighted in green in the graph below.
Excess Annual Returns Awarded to Perfect Security Selection

This chart shows the excess returns an all-knowing portfolio manager could earn. Such a manager could predict which bonds would do best, then buy only the best ones. If there’s a ceiling for alpha in high yield fixed income, the grey bars are what it looks like. In non-crisis times, the ceiling is about 10.6% per year relative to the index for long-only bond portfolio managers.
As an imaginary fixed income manager, you might say, “10.6% a year is wonderful. That kind of alpha is great! I’m in the right line of work.”
Not so fast — 10.6% is your outperformance ceiling. It represents what a manager could earn if he or she could perfectly forecast the future. Based on our own research using machine-learning techniques to rank individual bonds, we estimate that an imperfect, real-world bond manager can at best consistently capture 10-20% of the ceiling, or 1%-2% of outperformance per year. And that doesn’t include the drag from investment management fees, transaction costs, and all of the other real-world frictions that eat away at net performance.
There is some good news. Active managers can more easily distinguish themselves in times of market stress, when the best securities start to outperform the worst ones – see the outperformance spikes of the recoveries from both the 2009 financial crisis and 2016 oil crisis.
But don’t get too excited – just because a crisis can sort the best bonds from the worst, doesn’t mean it’s obvious which are which. Often the best names in post-crisis recoveries were the worst names in prior investment periods. In other words, an active bond manager who must track a chosen benchmark will have to consider avoiding these risky past underperformers to avoid tracking risk.
All this adds up to suggest that, even though there’s some excitement around active management in fixed income at the moment, investors ought to cool their jets. It’s best to be wary of claims of potential outperformance within any asset class, including bonds, if the best individual securities aren’t different enough from the worst ones.
Counterpoint Tactical Income generally does not aim to outperform by picking the best individual bonds. Instead, our model targets asset allocation to lower-risk asset classes (1-5 year Treasuries) in times of stress vs. higher-risk asset classes (high yield bonds) during more favorable periods. Instead of searching for the slim pickings of alpha, we stick to our focus on managing downside risk via our trend following approach.
We’re happy that recent research has given some hope to active bond portfolio managers. But we believe it’s more realistic to allocate tactically – to take broad market risk when conditions are favorable, and to avoid such risk when markets appear to get rocky.