Momentum Leads While Value and Stability Factors Lag: Factor Performance YTD


As of March 11, 2026, year-to-date factor performance has been characterized by strong momentum leadership, improving quality exposure in developed markets, and persistent underperformance of defensive and valuation factors, with regional dispersion particularly evident in Asia. The Counterpoint Factor Scoreboard1 factor spread charts (Q5 minus Q1 quintile returns) highlight a market regime where trend persistence and earnings revisions dominate, while low-risk and valuation signals have lagged significantly.

These dynamics suggest the market environment in early 2026 has favored trend-following and sentiment driven strategies, while stability and valuation-driven allocations have struggled in the current risk-seeking market regime.

North America

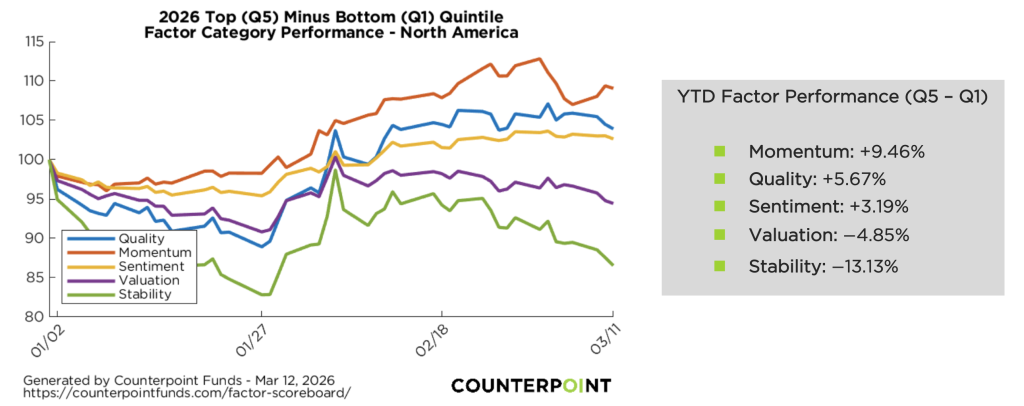
North American markets show clear momentum leadership, with the momentum factor producing a ~9.5% spread between the top and bottom quintiles, the strongest factor signal across all regions. This result suggests that recent winners have continued to outperform laggards, consistent with a market environment driven by earnings revisions, AI-related technology leadership, and persistent sector trends.

Quality also delivered strong performance, generating a 5.7% spread, indicating investor preference for companies with stronger profitability and balance sheet characteristics. The quality factor typically emphasizes firms with high return on equity, stable earnings growth, and lower leverage, attributes that tend to outperform during periods of macro uncertainty.

In contrast, valuation and stability factors lagged, with North American low-risk stability factor posting the worst performance of any factor globally at −13.13%. This reflects a continued shift toward higher beta and cyclical exposures, where investors favor growth-oriented equities rather than defensive, low-volatility stocks.

Europe

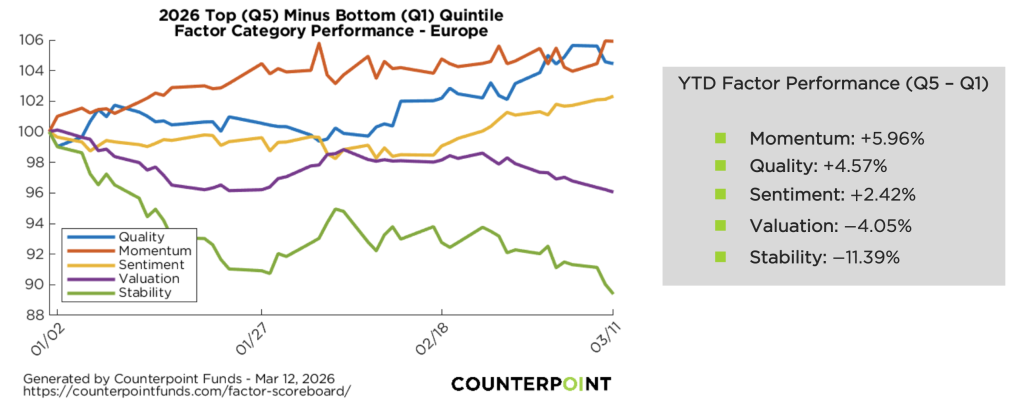
European factor performance broadly mirrors North America but with slightly more moderate dispersion among the factors. Momentum again leads, generating a nearly 6% return, as recent winner stocks have continued to win and recent loser stocks have continued to lose, confirming the persistence of cross-sectional price trends among European equities. Quality also delivered positive results, indicating that firms with stronger financial fundamentals and profitability characteristics have outperformed weaker peers.

As in North America, valuation factors struggled in Europe, with cheaper stocks underperforming higher-multiple peers. This dynamic reflects a continuation of the global pattern in which growth and earnings momentum remain dominant market drivers. The stability factor again underperformed significantly, highlighting the ongoing rotation away from low-volatility defensive equities.

Asia

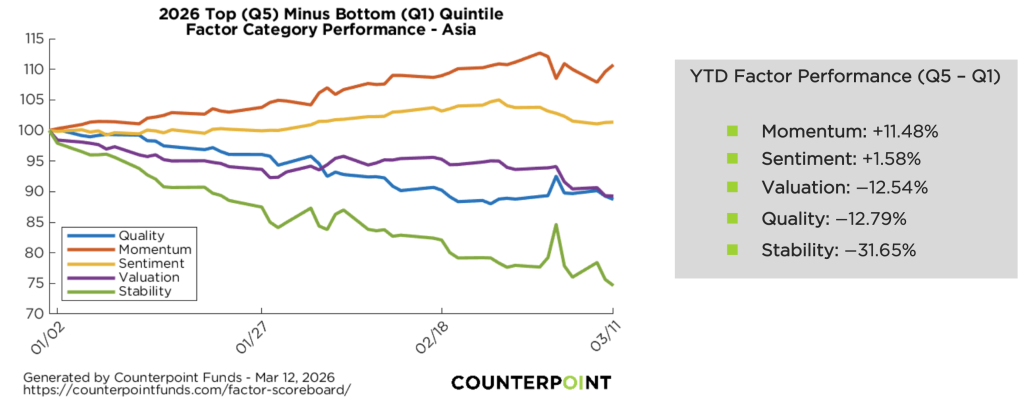
Asia displays the most extreme factor dispersion among the three regions. Momentum again dominates with a +11.5% return. However, unlike in North America and Europe, quality has underperformed significantly in Asia, producing a 12.8% return, suggesting that lower-quality firms have outperformed higher-quality companies. This dynamic may reflect speculative rotations, policy-driven market moves, or sector-specific recoveries in cyclical industries. Valuation factors also lagged sharply, indicating that cheaper stocks did not outperform expensive ones, despite significant dispersion in earnings expectations across the region. The most dramatic result appears in the stability factor, where low-volatility stocks lagged high-beta stocks by over 30%, signaling a highly risk-seeking market environment.

Cross-Regional Factor Trends

Momentum Dominance

Momentum led in all three regions, with returns ranging from 6% to 11%, confirming that trend persistence remains a major driver of equity returns.

Weakness in Defensive Factors

Low-volatility (Stability) has been the weakest factor globally, particularly in Asia and Europe. This suggests:

  • Investors are favoring risk-taking over capital preservation
  • Higher-beta equities are leading markets
  • Defensive sectors such as utilities and consumer staples may be lagging
Value Struggles

The value/valuation factor remains negative in all regions, suggesting the market continues to favor growth and earnings acceleration over cheap stocks.

Regional Differences
  • North America: Balanced factor leadership between momentum and quality
  • Europe: Similar trends but with smaller spreads
  • Asia: Extreme dispersion with large momentum gains and stability factor underperformance

Key Takeaways for Investors

  1. Momentum is the strongest factor globally, delivering the largest spreads across North America, Europe, and Asia as stocks with strong recent performance continue to outperform laggards.
  2. Quality has performed well in developed markets, with profitable, financially strong companies outperforming weaker peers in both North America and Europe year-to-date.
  3. Sentiment signals have been moderately positive, reflecting improving analyst revisions and investor expectations across multiple regions.
  4. Valuation (value) factors have lagged globally, as higher-growth and higher-multiple stocks have continued to outperform cheaper equities.
  5. Defensive and low-volatility stocks have significantly underperformed, indicating strong investor appetite for higher-beta and more cyclical equities.
  6. Asia shows the greatest factor dispersion, with strong momentum leadership alongside particularly weak performance from defensive and valuation factors.

Important Risk Information

Investing involves risk including the possible loss of principal. Investment return and principal value of an investment will fluctuate so that an investor’s shares, when redeemed, may be worth more or less than their original cost. The forecast and/or opinions may not come to pass and are subject to change. Investing in stocks and or bonds involves risk. It is not possible to invest in an index.

This is an informational resource only and is not investment advice. The above factor category returns do not represent the performance of an investment. We compute factor categories by blending returns of individual factors in an equal-weighted manner. Counterpoint uses these individual factors as early-stage inputs to the Counterpoint Machine Learning Model™ market-neutral strategies. These returns are meant to give investors an indication of what is happening to broad factor return categories for various time frames. While these are not returns to Counterpoint’s investment strategies, there may be a correlation between performance on the Factor Scoreboard and some of the firm’s market-neutral investment offerings.

There is no guarantee that any investment strategy will achieve its objectives, generate profits or avoid losses.

Factor Scoreboard Methodology

The rankings used to group periodic returns are re-calculated daily based on live market and financial data, and factor category returns are based on live changes in ranking. Year-to-date factor returns are formulated using compounded daily factor returns given daily changing rankings within the period, while trailing 5-day and month-to-date factor returns are formulated using only the latest day’s ranking. This will explain differences between month-to-date and year-to-date returns when date periods overlap.

The above factor returns are grouped by quintiles. The 1st quintile (Q1) represents the average daily return of the lowest 20% ranking companies (potential shorts) for the category. The 5th quintile (Q5) represents the average periodic return for the top 20% ranking companies (potential longs) within the same category. Q5-Q1 is the periodic return to a theoretical portfolio that is long all of the top ranked companies and short the lowest ranked companies within the category. This represents an attempt to capture the spread in performance between “good” and “bad” companies. These return calculations assume no transaction costs or market frictions. These returns do not represent the returns of the Funds’ models. They represent raw factor category returns and are unoptimized long-short returns determined with no consideration of market beta or industry exposure.

These funds invest in stocks chosen by a set of machine-learning models that use the factors within these broad category rankings as an input component, but may invest outside of the top and bottom quintiles for any individual factor or factor category as it balances the interactions between many factors simultaneously. Counterpoint collects market, fundamentals, and other financial data from S&P Global Market Intelligence to analyze a tradable universe of global stocks. For each stock, Counterpoint ranks individual factor exposures based on academic research. Counterpoint then takes the average return for the evaluation period within each ranking quintile, and then further averages that return across multiple factors within a category to produce a factor category return as displayed above. The individual factors within the above factor categories are actual factors that Counterpoint’s model considers in its aggregate scoring process.

Definitions

The Counterpoint Factor Scoreboard is a proprietary tool that allows investors to see which factor strategies have been “working” and which are struggling across different geographies.

An Earnings Revision Strategy is an investment approach that selects stocks based on changes in analyst forecasts for future earnings per share (EPS). It operates on the principle that stocks with upward-revised earnings estimates tend to outperform, while those with downward revisions underperform.

A Trend-Following Strategy is a rules-based investment approach that seeks to capture gains by analyzing the current direction of market prices rather than predicting future turning points. It involves going long during uptrends and selling or shorting during downtrends, with the goal of riding a sustained move.

Quality – Rankings based on financial statement quality characteristics, i.e. the Profitability anomaly.

Momentum – Rankings based on historical market returns that have predictive characteristics.

Sentiment– Rankings reflect indicators of outlook such as revisions to analyst estimates of future earnings, share issuance changes, or measures of short interest and demand in the share lending market.

Valuation – Rankings based on measures of company valuation such as price/sales ratio, and prices/earnings ratio.

Stability – Rankings based on measures of underlying company risk, such as volatility or beta.

A Long-Short Strategy is an investment approach, popular with hedge funds, that profits by buying (going long) undervalued stocks expected to rise and simultaneously selling borrowed (going short) overvalued stocks expected to fall, aiming to generate returns regardless of overall market direction by exploiting both upward and downward price movements while potentially reducing risk and managing taxes.

Short (going short) means that the default of an issuer or group of issuers leads to a gain for the institution, regardless of the type of instrument or transaction creating the exposure.

Long (going long) means that the default of an issuer or group of issuers leads to a loss for the institution, regardless of the type of instrument or transaction creating the exposure.

20260313-5302118

Recent Perspectives

Mutual Funds involve risk including the possible loss of principal. Investors should carefully consider the investment objectives, risks, charges and expenses of the funds managed by Counterpoint Funds. This and other important information about the funds is available in their prospectuses, which can be obtained at counterpointfunds.com or by calling 844-273-8637. The prospectuses should be read carefully before investing. The Counterpoint Funds fund family is distributed by Northern Lights Distributors, LLC member FINRA/SIPC. To reach the Counterpoint sales team, please refer to our contact page.

20250121-4174925

Thank you!

We’ve received your request for the featured event collateral. A Counterpoint Funds team member will be in touch shortly.

Subscribe to stay up to date on and receive our monthly perspective.

Thank you!

We’ve received your meeting request and a Counterpoint Funds team member will be in touch shortly.

Subscribe to stay up to date on and receive our monthly perspective.

Thank you!

We’ve received your event registration request and will be in touch shortly.

Subscribe to stay up to date on Counterpoint Funds and receive our monthly perspective.

Thank you!

We have received your application and look forward to reviewing your qualifications for the role. If your application seems like a good fit, we will contact you to discuss next steps.

Thank you again for your application and interest in joining the Counterpoint team!

Thank you!

We’ve received your message. A Counterpoint Funds team member will contact you soon.

Subscribe to stay up to date and receive our monthly perspective.