Meme Stocks: How Do You Like Your Odds?


As a group, meme stocks underperform the rest of the stock market, except in brief, exhilarating periods of outperformance. The long-term risk-reward profile of meme stocks is important to consider, especially when some investors are considering whether the GameStop wave of 2020 and 2021 may now be behind us. As tech stocks, growth stocks, and innovation strategies have lately shown some signs of weakness, investors should evaluate how their portfolios are positioned when it comes to valuation risk.

The NASDAQ and S&P have Entered a Correction
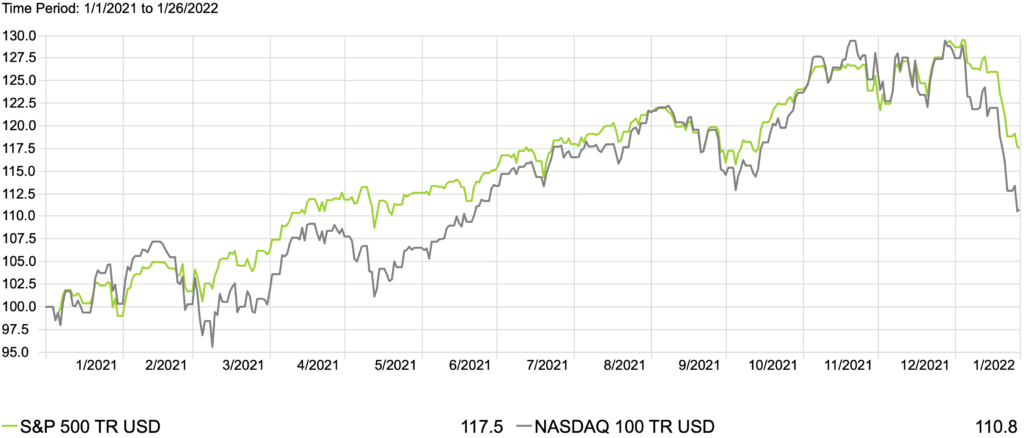
Source: Morningstar.

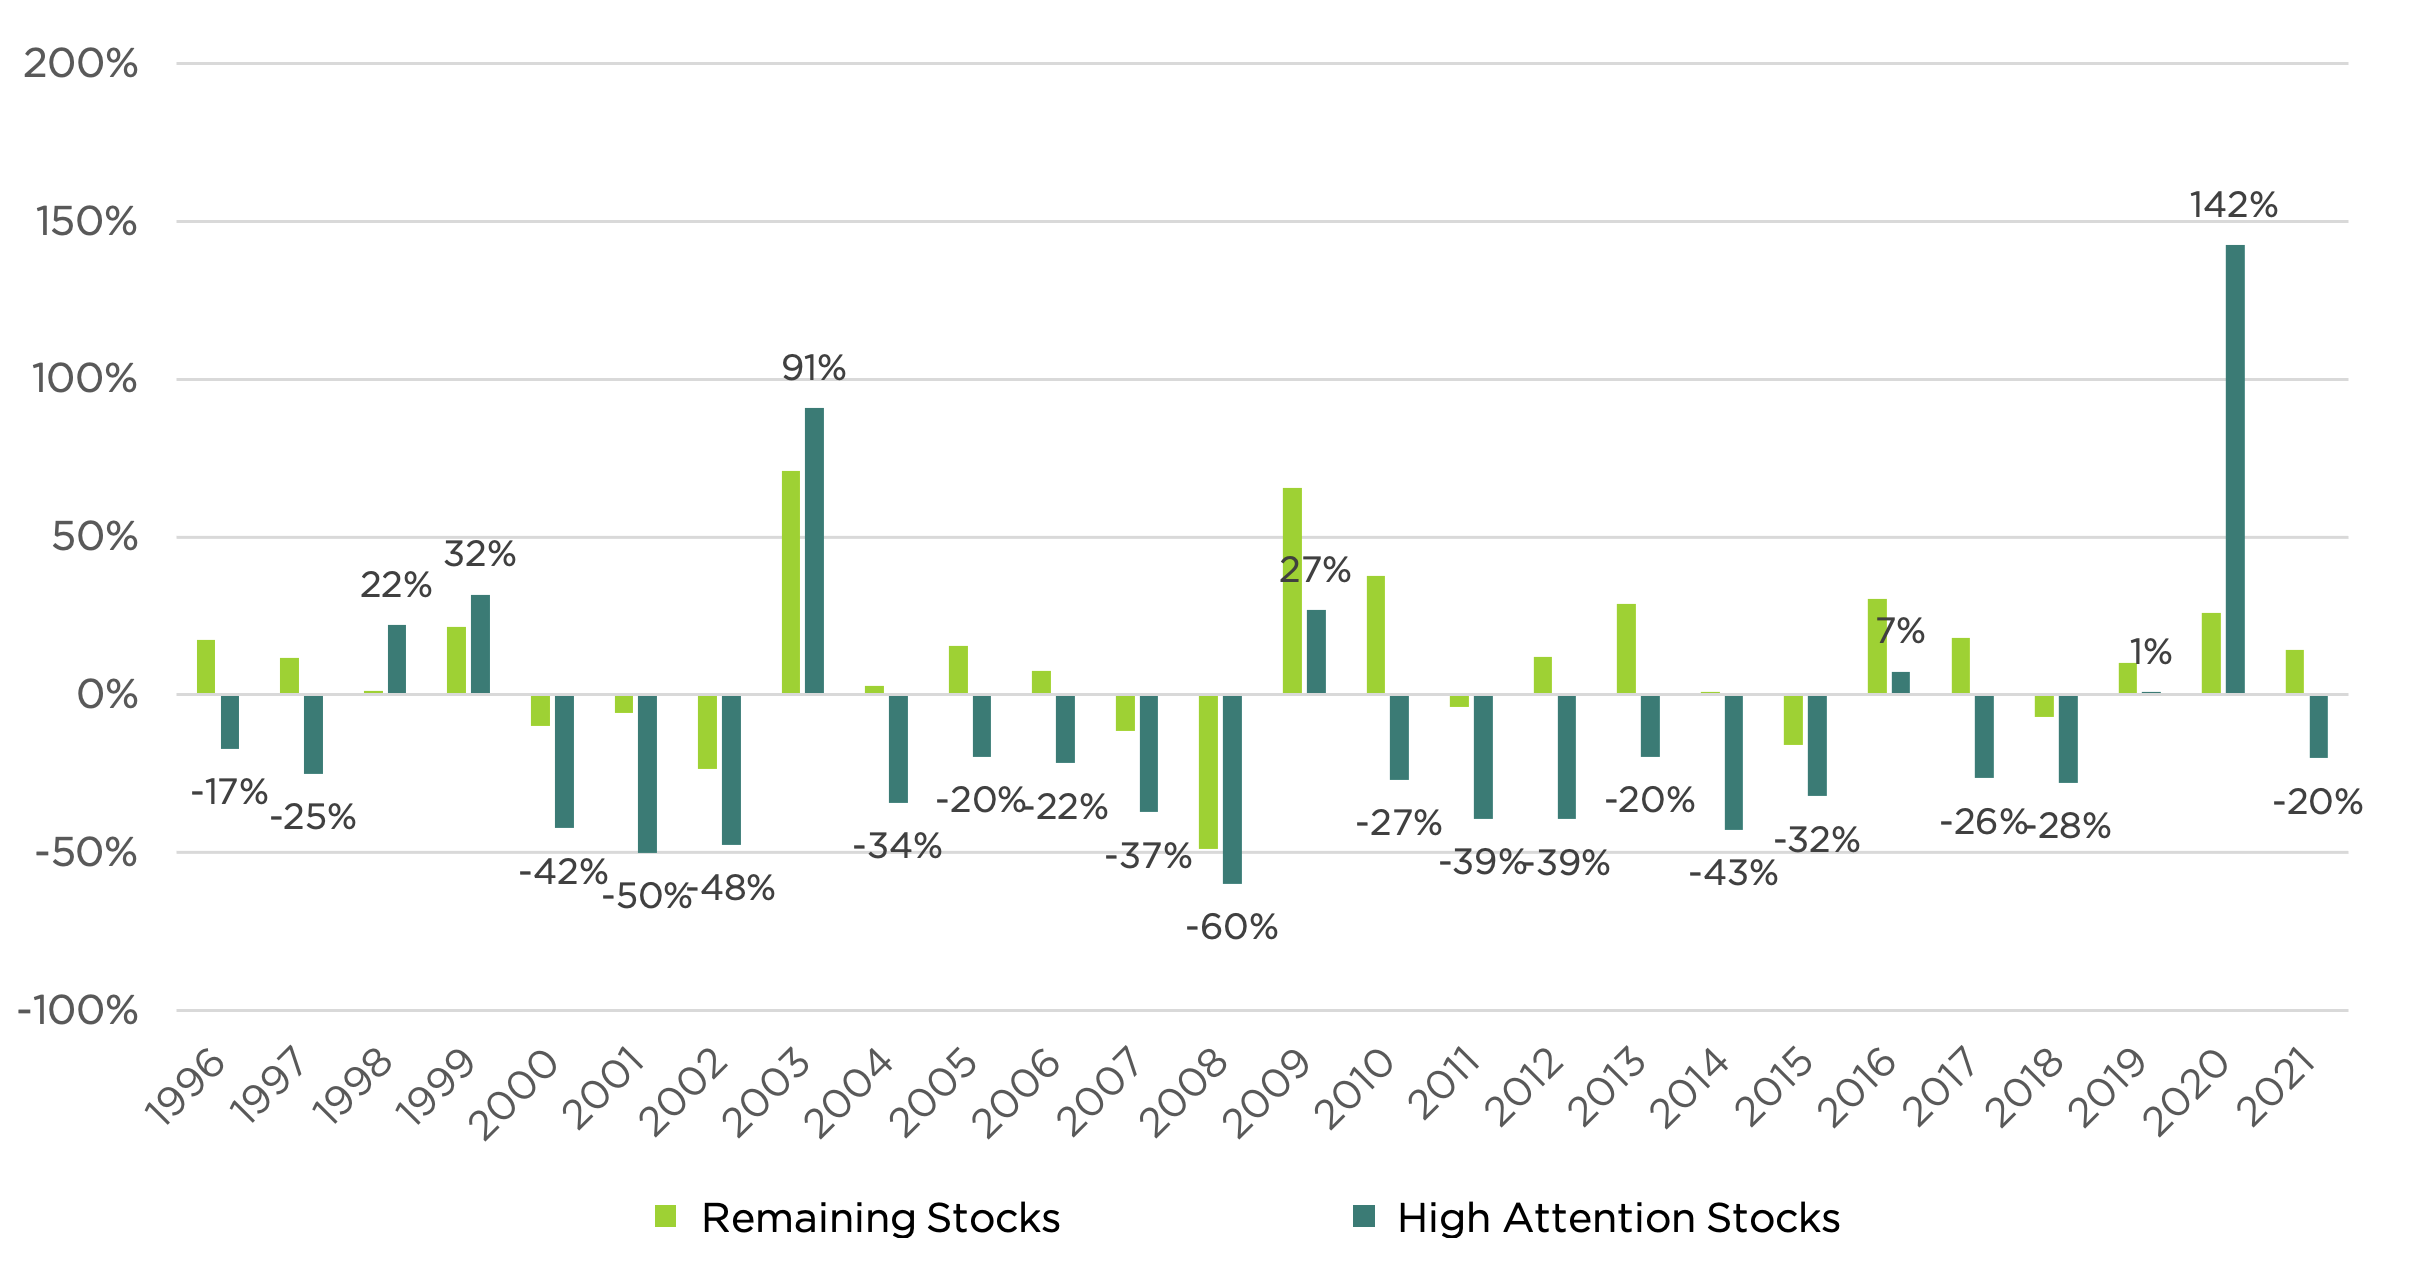
Since the mid-1990s, high attention stocks have grabbed hold of the market’s imagination in 1998, 1999, 2003, and most dramatically in 2020 when it became part of the US cultural zeitgeist and were coined “meme stocks.”  Those periods are: The peak of the dot-com bubble; 2003, a very strong year for the stock market; and 2020, when global pandemic helped engineer a Reddit/GameStop day trading environment that is without precedent in investment history.

We all know meme stocks when we see them, but what are they exactly? We defined meme stocks as stocks whose trading volume (a measure of investor attention) has risen out of proportion to their size (measured by market capitalization). Stocks with monthly trading volume greater than their market cap are classified as “meme stocks.”

While the good times for meme-like stocks are usually exciting, those rallies are the exceptions. In the past 25 years, high attention “meme-like” stocks have generated positive 1-year returns only five times. In the other 20, they’ve lost investors’ money. Meme stocks have only outperformed non-meme stocks when both groups have had positive performance. And when meme stocks have negative returns, the rest of the market outperforms.

High Attention Stocks In the US vs Remaining Stocks (Equal Weighted Baskets)
Source: S&P Global Market Intelligence.

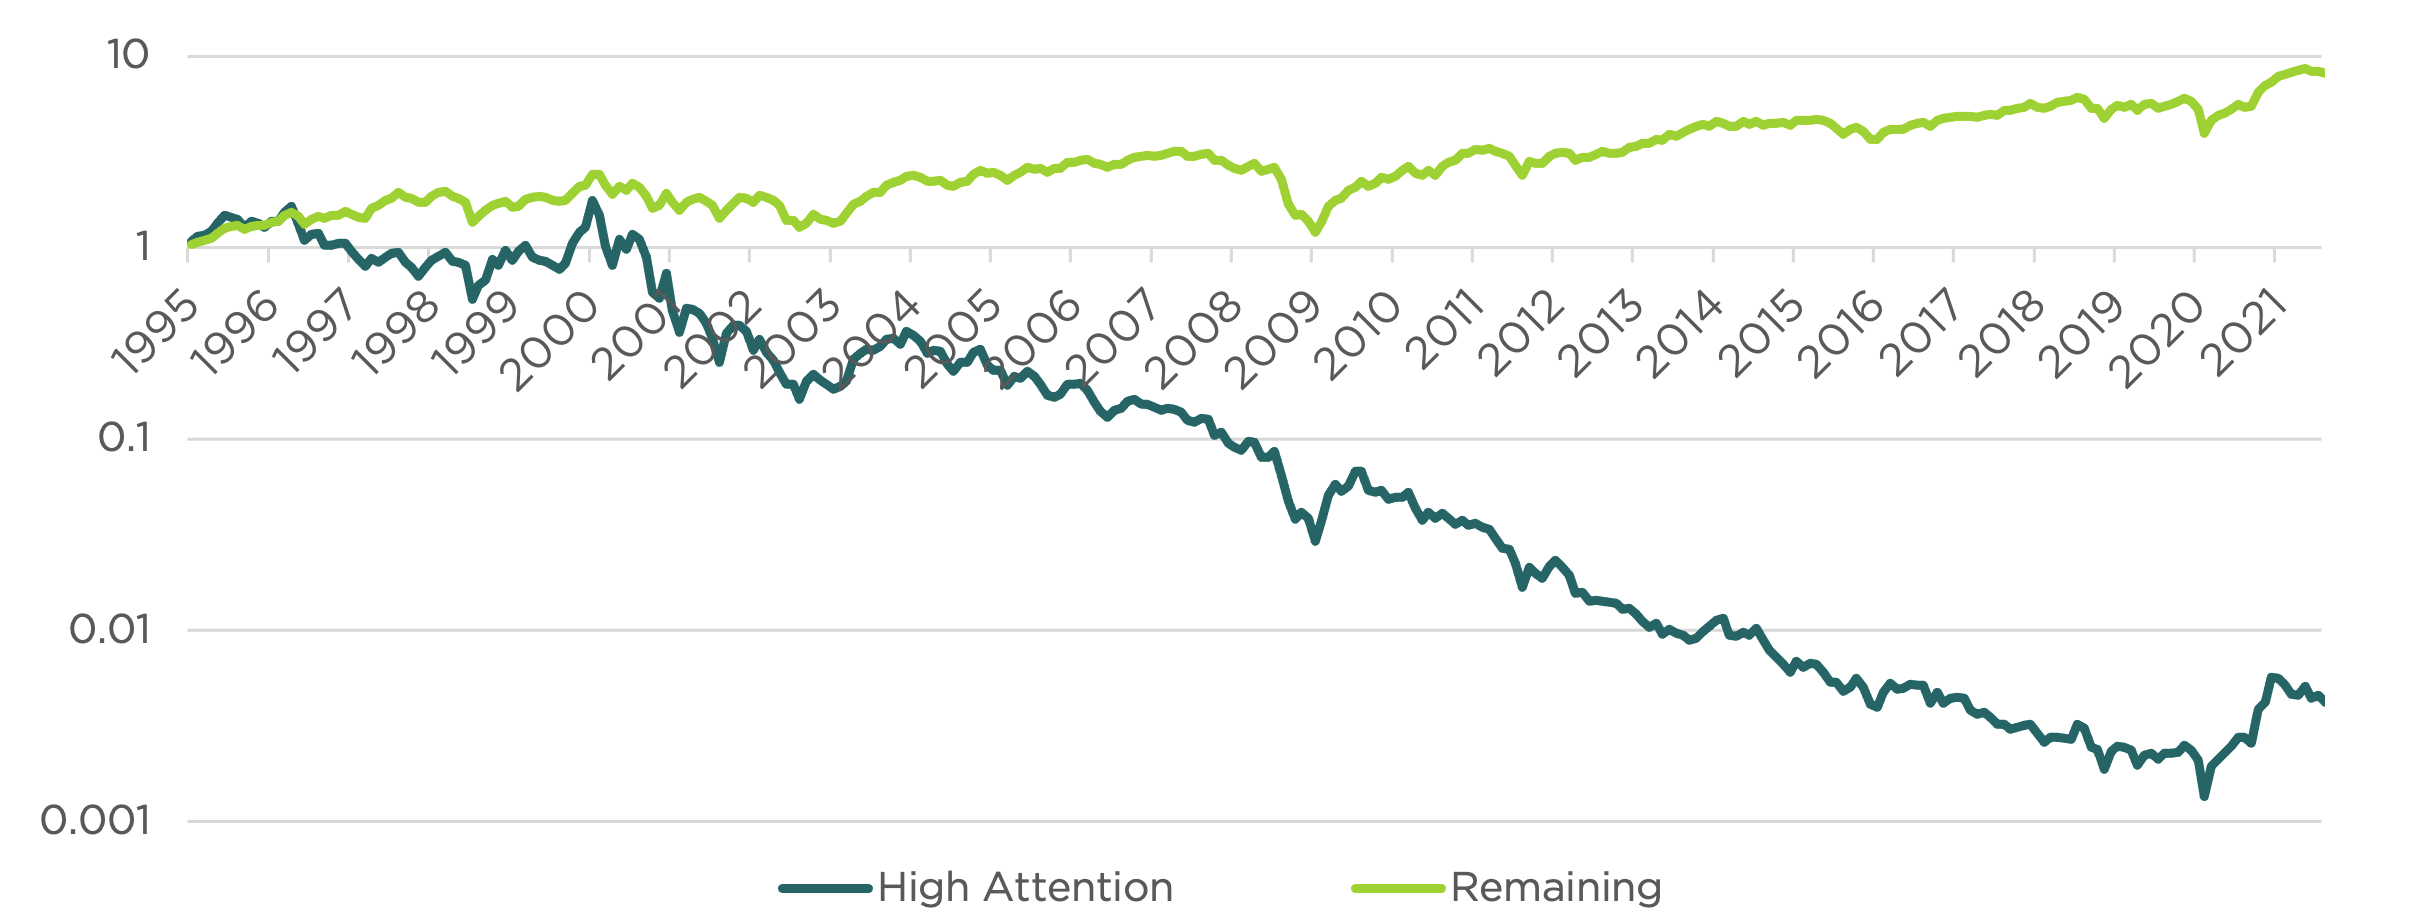
Meme stocks are generally defined by two characteristics: An exhilarating rocket ship ride up, and a subsequent bout of dismal performance. As long-term bets, they don’t tend to do very well.

Return of High Attention Stocks vs Remaining Stocks, 1995 – Present (>100M marketcap US)
Source: S&P Global Market Intelligence.R

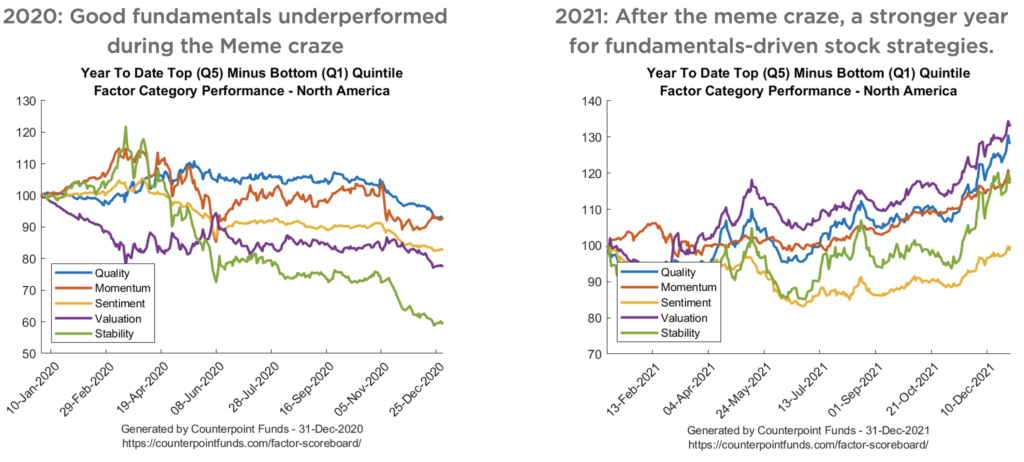
Meme stocks represent the extreme end of the stock market – the stocks whose prices are most affected by investor attention and enthusiasm. But there are other sources of risk that are related to meme stock risk. Investors may wish to consider whether valuation risk in U.S. stocks deserves additional attention. The swing from meme stock outperformance in 2020 to underperformance in 2021 accompanied a shift from historically bad performance for fundamentals-driven stock strategies to a period of very strong performance.
Source: S&P Global Market Intelligence.

Conclusion

Systematic strategies that seek exposure to factors like quality, momentum, and value are designed to manage meme- and valuation-related risk in stock markets. Investors who may have become overweight growth, innovation, and sentiment-driven “meme” trades may wish to consider strategies that can diversify valuation-related risk within the stock market.

Investors should carefully consider the investment objectives, risks, charges and expenses of the funds managed by Counterpoint Mutual Funds. This and other important information about the funds are available in their prospectuses, which can be obtained at counterpointfunds.com or by calling 844-273-8637. The prospectuses should be read carefully before investing. The Counterpoint Mutual Funds fund family is distributed by Northern Lights Distributors, LLC member FINRA/SIPC. Counterpoint Mutual Funds, LLC is not affiliated with Northern Lights Distributors, LLC member FINRA/SIPC.


Important Risk Information

Past performance is no guarantee of future results. There is no guarantee that any investment will achieve its objectives, generate positive returns, or avoid losses. The Adviser’s reliance on its strategy and judgments about the attractiveness, value and potential appreciation of particular securities and the tactical allocation among investments may prove to be incorrect and may not produce the desired results.


Methodology

The above factor returns are grouped by quintiles. The 1st quintile (Q1) represents the average daily return of the lowest 20% ranking companies (potential shorts) for the category. The 5th quintile (Q5) represents the average periodic return for the top 20% ranking companies (potential longs) within the same category. Q5-Q1 is the periodic return to a theoretical portfolio that is long all of the top ranked companies and short the lowest ranked companies within the category. This represents an attempt to capture the spread in performance between “good” and “bad” companies. These return calculations assume no transaction costs or market frictions. These returns do not represent the returns of the Funds’ models. They represent raw factor category returns, and are unoptimized long-short returns determined with no consideration of market beta or industry exposure.

There is no guarantee that any investment strategy will achieve its objectives, generate profits or avoid losses.


Index Definitions

S&P500 USD includes 500 leading companies in leading industries of the U.S. economy and is a proxy for the total stock market. BBgBarc Agg Bond refers to the Bloomberg Barclays Aggregate Bond Index, which is comprised of government securities, mortgage-backed securities, asset-backed securities and corporate securities with maturities of one year or more to simulate the universe of bonds in the market. Morningstar is an independent provider of financial information. Morningstar performance rankings are based on total return without sales charge relative to all share classes of mutual funds with similar objectives and determined by Morningstar. Correlation measures how two securities move in relation to one another based on monthly returns.

5188-NLD-01/28/2022

Recent Perspectives

Mutual Funds involve risk including the possible loss of principal. Investors should carefully consider the investment objectives, risks, charges and expenses of the funds managed by Counterpoint Funds. This and other important information about the funds is available in their prospectuses, which can be obtained at counterpointfunds.com or by calling 844-273-8637. The prospectuses should be read carefully before investing. The Counterpoint Funds fund family is distributed by Northern Lights Distributors, LLC member FINRA/SIPC. To reach the Counterpoint sales team, please refer to our contact page.

5516-NLD-09/01/2021


Thank you!

We’ve received your request for the featured event collateral. A Counterpoint Funds team member will be in touch shortly.

Subscribe to stay up to date on and receive our monthly perspective.

Thank you!

We’ve received your meeting request and a Counterpoint Funds team member will be in touch shortly.

Subscribe to stay up to date on and receive our monthly perspective.

Thank you!

We’ve received your event registration request and will be in touch shortly.

Subscribe to stay up to date on Counterpoint Funds and receive our monthly perspective.

Thank you!

We have received your application and look forward to reviewing your qualifications for the role. If your application seems like a good fit, we will contact you to discuss next steps.

Thank you again for your application and interest in joining the Counterpoint team!

Thank you!

We’ve received your message. A Counterpoint Funds team member will contact you soon.

Subscribe to stay up to date and receive our monthly perspective.