High Yield’s Exposure to Stock Market Risk


After a steep drawdown and the return of volatility to U.S. stocks in recent weeks, it’s worth investigating the level of stock market risk an investor in high yield credit faces. High yield has a reputation as a risky “junk” investment. However, our analysis shows a relatively low co-movement with the stock market.

January ended poorly for investors in U.S. stocks, and the start to February was not kind, either. A quiet march higher that began after the 2016 presidential election was interrupted as the S&P 500 dropped around 10% from late January into early February.


S&P 500 Index
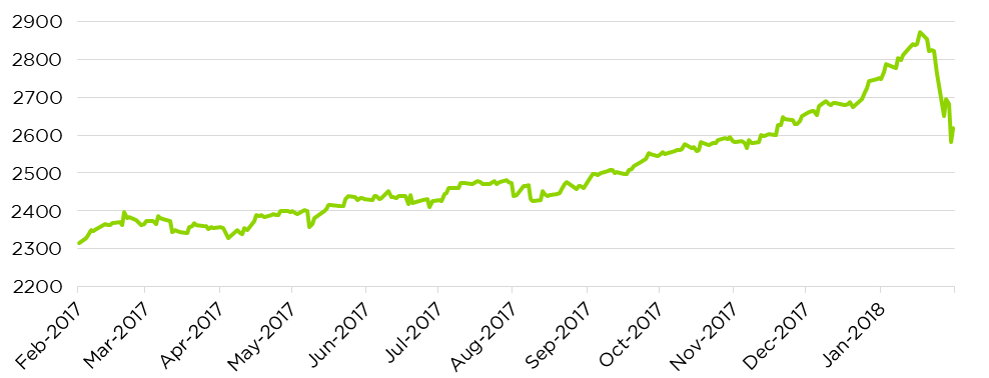
S&P 500 Index
Source: St. Louis FRED

Stock volatility as measured by the CBOE Volatility Index, which had been unusually low throughout 2016, spiked to levels last seen in summer of 2015.


CBOE Volatility Index (VIX)
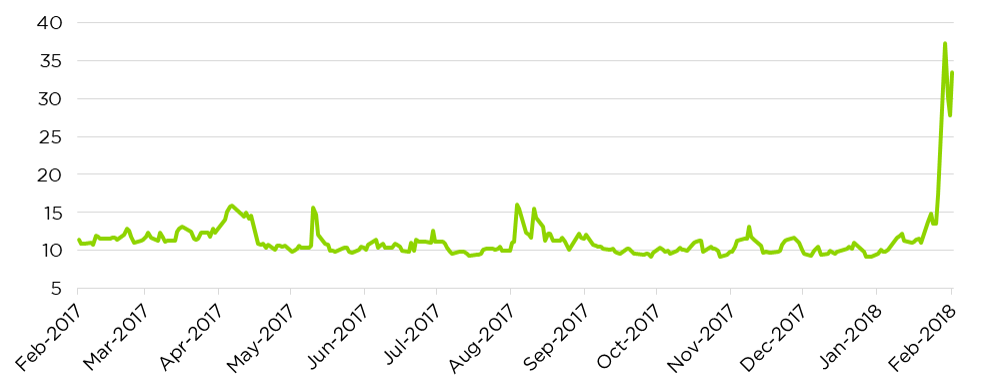
CBOE Volatility Index (VIX)
Source: St. Louis FRED

High yield was not spared, drawing down about 1.6% from late January highs.


ICE BofAML US High Yield Total Return Index Value
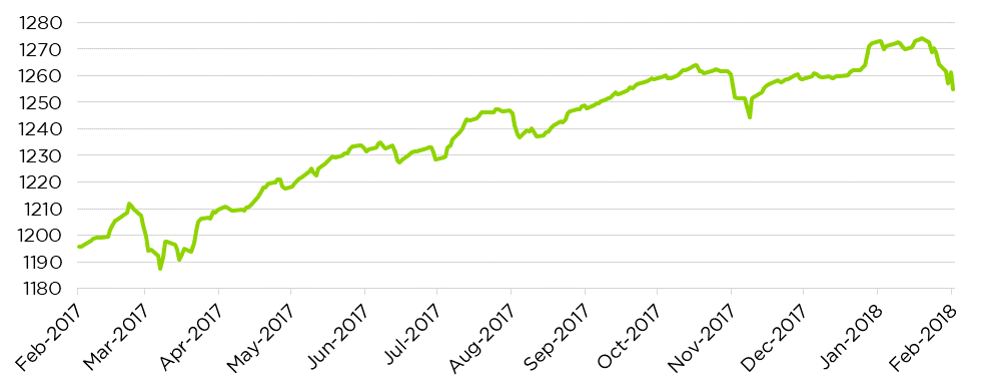
ICE BofAML US High Yield Total Return Index Value
Source: St. Louis FRED

Amid the tumult, the Counterpoint Tactical Income Fund entered a risk-off posture in early February and is now invested in short-duration U.S. Treasury securities and funds. This coinciding action between the U.S. stocks and high yield bonds prompts a question: How interrelated are the fates of these two asset classes?

We evaluated the rolling one-month beta of the iShares iBoxx $ High Yield Corporate Bond ETF, a passive proxy for a high yield index, to the S&P 500 for the past decade. Beta is often used to evaluate individual stocks’ co-movement with an index such as the S&P 500. A beta of 1 indicates exact co-movement with the index; a beta of 0 indicates no co-movement; and a negative beta indicates in inverse relationship.


Rolling Betas – HYG vs. S&P 500
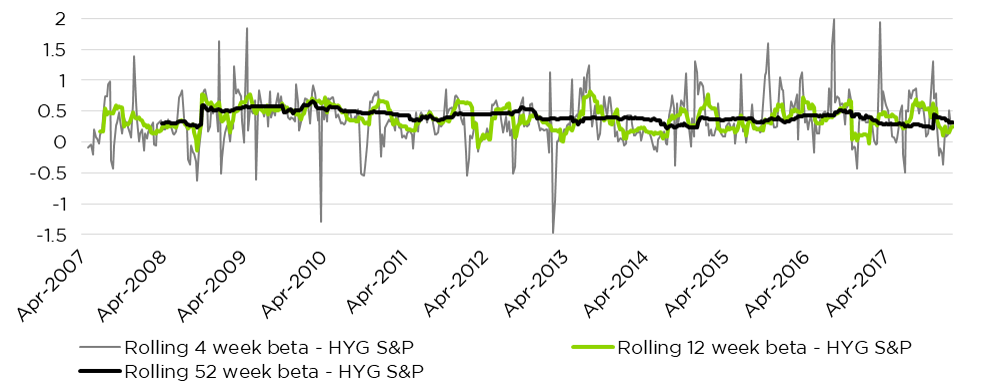
Rolling Betas - HYG vs. S&P 500
Source: Bloomberg.

Over the past 10 years, high yield bonds have shown inconsistent short-term co-movement with stocks as represented by the S&P 500, as can be seen by the noisy one-month relationship. On a quarterly basis, high yield’s beta with stocks ranges from roughly zero (no relationship) to a weak relationship of around 0.6. Over the past decade, the beta of high yield to the S&P 500 is 0.42, so for every percent of movement in the S&P 500, we expect less than half of that in high yield. (By way of anecdotal comparison, AT&T and Wal-Mart are two examples of large-cap stocks with betas below 0.5.)

There are periodic spikes of high monthly co-movement, but even these do not appear to be a dramatic concern. During periods when the four-week beta was above 1, the average one-month return on the S&P 500 was 1.3%.

As we have discussed in the past, over recent economic cycles high yield has tended to display an attractive risk profile according to a variety of measures – drawdown, variance of returns, and semi-deviation. On further examination, we now also find that the short-term relationship between high yield and stocks has lately been weaker than one might expect given high yield’s reputation as a “junk” investment.

While investment risk can emerge in any number of ways and no quantitative measure is perfect, history suggests that high yield’s risk profile is not overly intertwined with that of the stock market. This gives us further confidence that high yield makes a solid addition to the asset class mix in many portfolios. We believe that risk management through our quantitative trend following discipline further enhances the appeal of high yield credit.

Disclosures

The S&P 500 Total Return Index is a broad based unmanaged index of 500 stocks, which is widely recognized as representative of the US equity market in general, and includes dividend reinvestment in its value. The Chicago Board Options Exchange Volatility Index reflects a market estimate of future volatility, based on the weighted average of the implied volatilities for a wide range of strikes. 1st & 2nd month expirations are used until 8 days from expiration, then the 2nd and 3rd are used. The ICE BofAML US High Yield Master II Index is an unmanaged index that tracks the performance of US dollar denominated below investment grade rated corporate debt publicly issued in the US domestic market. The referenced indices are shown for general market comparisons and are not meant to represent the Funds. It is not possible to invest directly in an unmanaged index.

There is no assurance the Fund Advisor’s opinions of risk management will come to pass and past performance is no assurance of future results. Of course, there is no guarantee that any investment strategy will achieve its objectives, generate profits or avoid losses. Mutual Funds involve risk including the possible loss of principal. The use of leverage by the Fund or an Underlying Fund, such as borrowing money to purchase securities or the use of derivatives, will indirectly cause the Fund to incur additional expenses and magnify the Fund’s gains or losses. Derivative instruments involve risks different from, or possibly greater than, the risks associated with investing directly in securities and other traditional investments. There is a risk that issuers and counterparties will not make payments on securities and other investments held by the Fund, resulting in losses to the Fund.

Investors should carefully consider the investment objectives, risks, charges and expenses of the funds managed by Counterpoint Mutual Funds. This and other important information about the funds are available in their prospectuses, which can be obtained at counterpointfunds.com or by calling 844-273-8637. The prospectuses should be read carefully before investing. The Counterpoint Mutual Funds fund family is distributed by Northern Lights Distributors, LLC member FINRA/SIPC. Counterpoint Mutual Funds, LLC is not affiliated with Northern Lights Distributors, LLC member FINRA/SIPC.

4232-NLD-2/20/2018

Recent Perspectives

Mutual Funds involve risk including the possible loss of principal. Investors should carefully consider the investment objectives, risks, charges and expenses of the funds managed by Counterpoint Funds. This and other important information about the funds is available in their prospectuses, which can be obtained at counterpointfunds.com or by calling 844-273-8637. The prospectuses should be read carefully before investing. The Counterpoint Funds fund family is distributed by Northern Lights Distributors, LLC member FINRA/SIPC. To reach the Counterpoint sales team, please refer to our contact page.

5516-NLD-09/01/2021


Thank you!

We’ve received your request for the featured event collateral. A Counterpoint Funds team member will be in touch shortly.

Subscribe to stay up to date on and receive our monthly perspective.

Thank you!

We’ve received your meeting request and a Counterpoint Funds team member will be in touch shortly.

Subscribe to stay up to date on and receive our monthly perspective.

Thank you!

We’ve received your event registration request and will be in touch shortly.

Subscribe to stay up to date on Counterpoint Funds and receive our monthly perspective.

Thank you!

We have received your application and look forward to reviewing your qualifications for the role. If your application seems like a good fit, we will contact you to discuss next steps.

Thank you again for your application and interest in joining the Counterpoint team!

Thank you!

We’ve received your message. A Counterpoint Funds team member will contact you soon.

Subscribe to stay up to date and receive our monthly perspective.