Year-ahead commentary is challenging for us: We don’t have a crystal ball, and we believe predictions contribute more to investment mistakes than outperformance. But the New Year does...
READ MOREEnsemble of trend following signals adds model diversification
ETF wrapper has potential to minimize capital gain events resulting from internal active management
Deep liquidity of underlying holdings for this alternative ETF
A blended trend following and time series momentum strategy that changes exposure, in 20% increments, based on a blended score from 202 weighted signals.

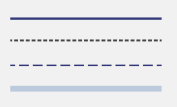
Blended Score
Momentum Signal
Moving Average Signal
Final Allocation
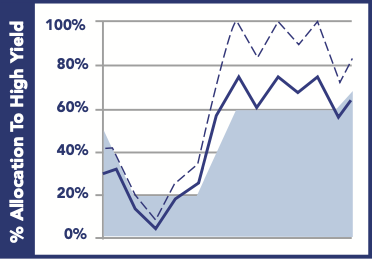
Risk-On: 100% High Yield Corporate Bond ETFs
The system is 100% Risk-On when the blended score is above 90% and the model has had at least five days to become fully invested in High Yield Corporate Bond ETFs. The blended score is derived from the percentage of closing prices of a reference index above 101 different moving averages and lookback returns being positive for 101 time-series momentum signals. From the Risk-On position the Index can change to the Blended Position.

Blended: High Yield Corporate Bond ETFs
& U.S. Treasury ETFs
When not in the Risk-On or Risk-Off position the Fund can hold a blended 80/20, 60/40, 40/60 or 20/80 allocation of High Yield Corporate Bond ETFs and either U.S. 3-7 Year Treasury ETFs or T-bill ETFs. The CP High Yield Trend Index determines the optimal allocation, rounded to the nearest 20% increment to reduce turnover and transaction costs, using a 75%/25% blend of the 101 moving average and 101 time series (momentum) lookback return signals. The final allocation can only change exposure in increments of 20% day-over-day and will remain unchanged if the rounded allocation varies by more than 5% from the recommended allocation.
The decision to be invested in U.S. 3-7 Year Treasury ETFs versus T-bill ETFs is dictated by a 3% stop rule mentioned in the Risk-Off section.

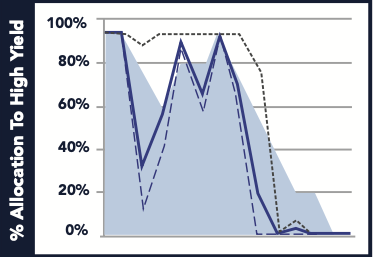
Risk-Off: 100% U.S. Treasury ETFs
When the blended score is below 10% for at least five consecutive business days, exposure to either U.S. 3-7 Year Treasury or U.S. T-bill ETFs will usually be set to 100%. The blended score is derived from the percentage of closing prices of a reference index above 101 different moving averages and lookback returns being positive for 101 time-series momentum signals. From the Risk-Off position, the Fund can change to the blended position.
If a 3-7 Year Treasury ETF experiences a 3% drawdown or greater after initial entry from the system, at any weighting of 20% or greater to the Fund, the system will reallocate the Treasury portion of the model entirely to U.S. T-Bill ETFs.

There is no guarantee that any investment strategy will achieve its objectives, generate profits or avoid losses.
FUND DETAILS
As Of 2025-12-15
Ticker HYTR
Primary Exchange NYSE
Cusip 66538R722
ISIN US66538R722
Inception Date 2020-01-21
Net Assets $225,793,044
Shares Outstanding 10,450,000
Volume 111,426
30 Day Median Mid Bid-Ask Spread 0.0459%
Gross Expense Ratio 2.89%
Net Expense Ratio (After Waivers) 0.79%
Net Expense Ratio (After Waivers Excluding Acquired Fund Expenses) 0.60%
Advisor Management Fee 0.50%
IOPV Ticker HYTR.IV
Related Index Ticker HYTREND Index
| As of 2026-02-12 | 1 DAY | 1 MO | 3 MO | 6 MO | 1 YR | 3 YR | 5 YR | YTD | QTD | SINCE INCEPTION | |
|---|---|---|---|---|---|---|---|---|---|---|---|
| Market Price | 21.87 | -0.09% | 0.23% | 1.66% | 3.35% | 5.38% | 7.03% | 2.29% | 0.69% | 0.69% | 1.91% |
| NAV | 21.86 | -0.09% | 0.18% | 1.71% | 3.36% | 5.43% | 7.02% | 2.28% | 0.64% | 0.64% | 1.91% |
| As of 2025-12-31 | 1 MO | 3 MO | 6 MO | 1 YR | 3 YR | 5 YR | YTD | QTD | SINCE INCEPTION | |
|---|---|---|---|---|---|---|---|---|---|---|
| Market Price | 21.72 | 0.46% | 1.23% | 3.36% | 5.96% | 7.18% | 2.33% | 5.96% | 1.23% | 1.83% |
| NAV | 21.72 | 0.51% | 1.14% | 3.36% | 6.11% | 7.16% | 2.33% | 6.11% | 1.14% | 1.83% |
| Days Traded at Premium | Days Traded At Discount | |
|---|---|---|
| Calendar Year 2025 | 164 | 16 |
| Q1 2026 | 17 | 3 |
The Adviser has contractually agreed to waive its fees and reimburse expenses of the Fund, until at least February 1, 2026 to ensure that total annual fund operating expenses after fee waiver and/or reimbursement will not exceed 0.60% of the Fund’s net assets. This is excluding (i) of any front-end or contingent deferred loads; (ii) brokerage fees and commissions; (iii) acquired fund fees and expenses; (iv) fees and expenses associated with investments in other collective investment vehicles or derivative instruments (including for example option and swap fees and expenses); (v) borrowing costs (such as interest and dividend expense on securities sold short); (vi) taxes; and (vii) extraordinary expenses, such as litigation expenses (which may include indemnification of Fund officers and Trustees, contractual indemnification of Fund service providers,other than the Adviser). This fee waiver and expense reimbursement are subject to possible recoupment from the Fund within the three years after the fees have been waived or reimbursed, if such recoupment can be achieved within the lesser of the foregoing expense limits in place at the time of recapture. This agreement may be terminated only by the Trust’s Board of Trustees on 60 days’ written notice to the Adviser.
Year-ahead commentary is challenging for us: We don’t have a crystal ball, and we believe predictions contribute more to investment mistakes than outperformance. But the New Year does...
READ MOREAt Counterpoint, we’ve been championing diversifier strategies for a while now—like the wise old friend who keeps reminding you to bring an umbrella just in case. These strategies...
READ MOREYear-ahead commentary is challenging for us: We don’t have a crystal ball, and we believe predictions contribute more to investment mistakes than outperformance. But the New Year does...
READ MORE
Download Holdings
NAME SYMBOL NET ASSET % MARKET PRICE($) SHARES HELD MARKET VALUE
ISHARES BROAD US USHY US 39.56 37.45 2,580,606 $96,643,694.70
BBH SWEEP VEHICLE 9BBH 1.02 100 2,500,904.5 $2,500,904.50
ISHARES IBOXX HI HYG US 29.72 80.79 898,481 $72,588,279.99
SPDR BLOOMBERG H JNK US 29.72 97.37 745,562 $72,595,371.94
Ex-Date Record Date Pay Date Short-Term Capital Gains Long-Term Capital Gains Dividend Income Total Distribution
12/12/2025 12/12/2025 12/17/2025 0.2296 0.2296
11/14/2025 11/14/2025 11/19/2025 0.0883 0.0883
10/17/2025 10/17/2025 10/22/2025 0.1269 0.1269
09/19/2025 09/19/2025 09/24/2025 0.0981 0.0981
08/15/2025 08/15/2025 08/20/2025 0.1059 0.1059
07/18/2025 07/18/2025 07/23/2025 0.1005 0.1005
06/13/2025 06/13/2025 06/20/2025 0.1043 0.1043
05/16/2025 05/16/2025 05/22/2025 0.1019 0.1019
04/17/2025 04/17/2025 04/23/2025 0.1018 0.1018
03/14/2025 03/14/2025 03/20/2025 0.1022 0.1022
02/14/2025 02/14/2025 02/20/2025 0.0963 0.0963
12/30/2024 12/30/2024 01/06/2025 0.0357 0.0357
12/12/2024 12/12/2024 12/18/2024 0.1372 0.1372
11/14/2024 11/15/2024 11/20/2024 0.1115 0.1115
10/17/2024 10/18/2024 10/23/2024 0.1109 0.1109
09/19/2024 09/20/2024 09/25/2024 0.1313 0.1313
08/15/2024 08/16/2024 08/21/2024 0.0574 0.0574
07/18/2024 07/19/2024 07/24/2024 0.1062 0.1062
06/13/2024 06/14/2024 06/20/2024 0.1057 0.1057
05/16/2024 05/17/2024 05/22/2024 0.1154 0.1154
04/18/2024 04/19/2024 04/24/2024 0.0947 0.0947
03/14/2024 03/15/2024 03/20/2024 0.105 0.105
02/15/2024 02/16/2024 02/21/2024 0.0954 0.0954
12/14/2023 12/15/2023 12/20/2023 0.2047 0.2047
11/16/2023 11/17/2023 11/22/2023 0.0525 0.0525
10/19/2023 10/20/2023 10/25/2023 0.1051 0.1051
09/14/2023 09/15/2023 09/20/2023 0.101 0.101
08/17/2023 08/18/2023 08/23/2023 0.0994 0.0994
07/13/2023 07/14/2023 07/19/2023 0.1031 0.1031
06/15/2023 06/16/2023 06/21/2023 0.0883 0.0883
05/18/2023 05/19/2023 05/24/2023 0.0953 0.0953
04/13/2023 04/14/2023 04/19/2023 0.0974 0.0974
03/16/2023 03/17/2023 03/22/2023 0.1124 0.1124
02/16/2023 02/17/2023 02/22/2023 0.1035 0.1035
12/15/2022 12/16/2022 12/21/2022 0.1431 0.1431
11/17/2022 11/18/2022 11/23/2022 0.0326 0.0326
10/18/2022 10/19/2022 10/24/2022 0.0182 0.0182
09/15/2022 09/16/2022 09/21/2022 0.0178 0.0178
08/18/2022 08/19/2022 08/24/2022 0.0136 0.0136
07/14/2022 07/15/2022 07/20/2022 0.0187 0.0187
05/17/2022 05/18/2022 05/23/2022 0.0147 0.0147
12/15/2021 12/16/2021 12/21/2021 0.1519 0.1519
11/15/2021 11/16/2021 11/22/2021 0.0645 0.0645
10/15/2021 10/18/2021 10/21/2021 0.0708 0.0708
09/15/2021 09/16/2021 09/21/2021 0.0669 0.0669
08/13/2021 08/16/2021 08/19/2021 0.1001 0.1001
07/15/2021 07/16/2021 07/21/2021 0.0742 0.0742
06/15/2021 06/16/2021 06/21/2021 0.067 0.067
05/14/2021 05/17/2021 05/20/2021 0.071 0.071
04/15/2021 04/16/2021 04/21/2021 0.0699 0.0699
03/15/2021 03/16/2021 03/22/2021 0.0748 0.0748
02/12/2021 02/16/2021 02/18/2021 0.0717 0.0717
12/15/2020 12/16/2020 12/21/2020 0.1701 0.1701
11/13/2020 11/16/2020 11/19/2020 0.0997 0.0997
10/15/2020 10/16/2020 10/21/2020 0.0707 0.0707
09/15/2020 09/16/2020 09/21/2020 0.0828 0.0828
08/14/2020 08/17/2020 08/20/2020 0.0717 0.0717
07/15/2020 07/16/2020 07/21/2020 0.0245 0.0245
06/15/2020 06/16/2020 06/16/2020 0.0104 0.0104
05/15/2020 05/18/2020 05/21/2020 0.0105 0.0105
04/15/2020 04/16/2020 04/21/2020 0.014 0.014
03/13/2020 03/16/2020 03/19/2020 0.0836 0.0836
02/14/2020 02/18/2020 02/21/2020 0.0958 0.0958
Investments in the CP High Yield Trend Fund involves risk including possible loss of principal and may not be suitable for all investors. The Fund is new with a limited history of operations. There is no assurance that the Fund’s strategy for allocating assets will achieve its investment objectives. The extent that Authorized Participants (AP) exit the business or are unable to proceed with creation or redemption orders, Fund shares may be more likely to trade at a premium or discount to net asset value and possibly face trading halts or delisting. Issuers of a security and other instruments may not be able to make principal and interest payments when due. Fluctuation in the value of equity securities held by the Fund causes the net asset value of the Fund to fluctuate.
The Fund is structured as an ETF and is subject to risks including, market price variance, trading issues and not being individually redeemable. ETF investments involve advisory and other expenses which will be indirectly paid by the Fund. The Fund’s investments may include ETFs with foreign securities, which are subject to risks beyond those associated with investing in domestic securities. Growth stocks may react differently to market events and are subject to more abrupt market movements. The Fund’s income may decline when yields fall and an increase in rates may cause the value of securities held by the Fund to decline. High yield or ‘junk’ bonds present greater risk than bonds of higher quality. There is no assurance that the Index Provider will compile, compose or calculate the index accurately and the Fund’s performance may diverge from that of the index.
ETF shares are not redeemable with the issuing fund other than in large Creation Unit aggregations. Instead, investors must buy or sell ETF Shares in the secondary market with the assistance of a stockbroker. In doing so, the investor may incur brokerage commissions and may pay more than net asset value when buying and receive less than net asset value when selling. The NAV of the Fund’s shares is calculated each day the national securities exchanges are open for trading as of the close of regular trading on the New York Stock Exchange (“NYSE”), normally 4:00 p.m. Eastern time (the “NAV Calculation Time”). Shares are bought and sold at market price (closing price) not NAV. Market price returns are based on the midpoint of the bid/ask spread at 4:00 pm Eastern Time (when NAV is normally determined).
An active secondary market for the Fund’s shares may not exist. Although the Fund’s shares will be listed on an exchange, subject to notice of issuance, it is possible that an active trading market may not develop or be maintained. There is no guarantee that distributions will be paid.
5516-NLD-09/01/2021
We’ve received your request for the featured event collateral. A Counterpoint Funds team member will be in touch shortly.
Subscribe to stay up to date on and receive our monthly perspective.
We’ve received your meeting request and a Counterpoint Funds team member will be in touch shortly.
Subscribe to stay up to date on and receive our monthly perspective.
We’ve received your event registration request and will be in touch shortly.
Subscribe to stay up to date on Counterpoint Funds and receive our monthly perspective.
We have received your application and look forward to reviewing your qualifications for the role. If your application seems like a good fit, we will contact you to discuss next steps.
Thank you again for your application and interest in joining the Counterpoint team!
We’ve received your message. A Counterpoint Funds team member will contact you soon.
Subscribe to stay up to date and receive our monthly perspective.