High Yield and Changes in Credit Spread


Many investors have been wondering about what place high yield (or investments with high yield exposure, such as high yield trend following strategies) should play in a portfolio at this stage in 2023, given the way high yield credit spreads have narrowed year-to-date.

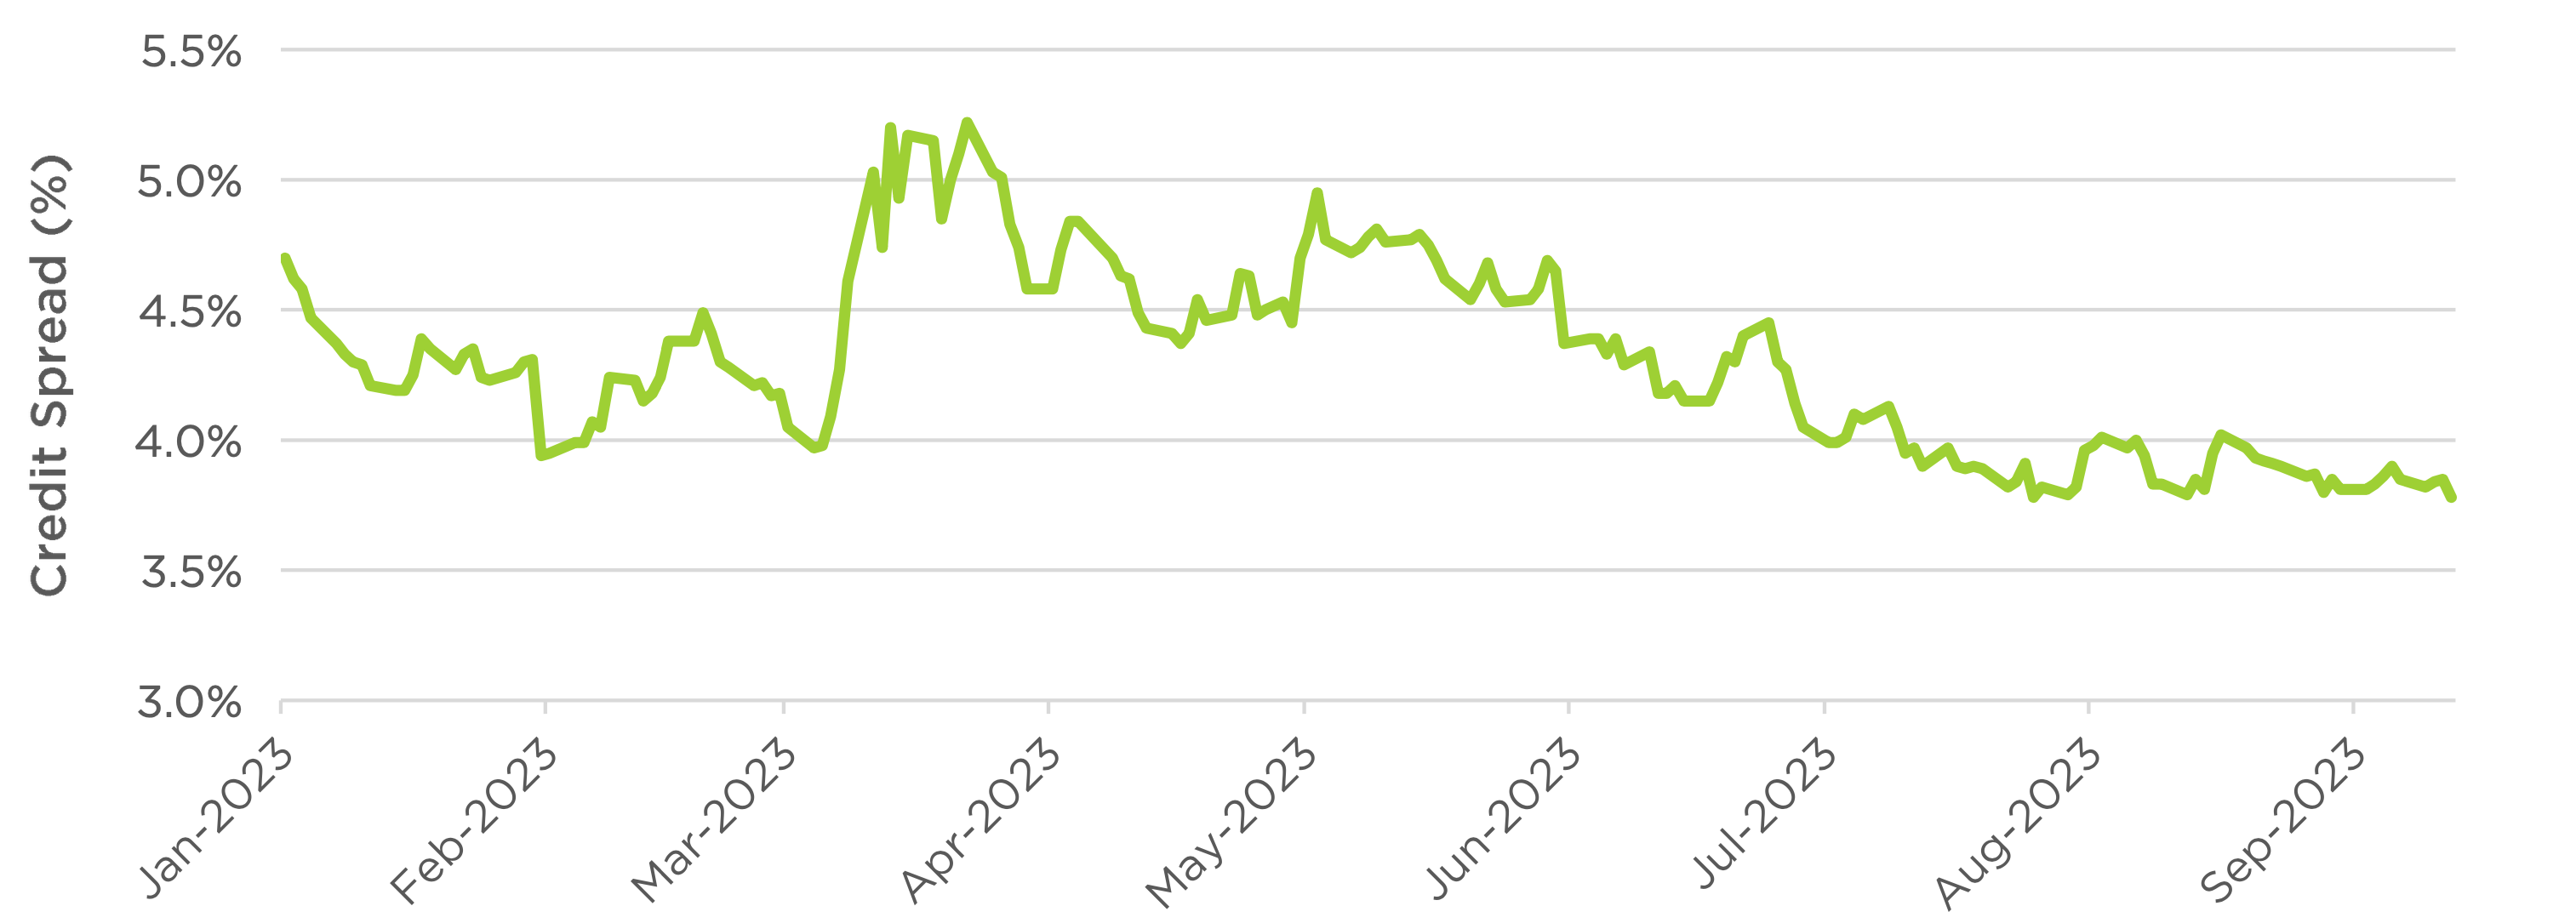
Credit spreads, which represent the additional yield investors earn above Treasury yields for taking on more credit risk, have been trending lower since March, when markets were scared by some high-profile regional bank failures.


High Yield Option-Adjusted Spread Year-To-Date

High Yield Option-Adjusted Spread Year-To-Date
Source: Bloomberg. Time period: 01/01/2023 to 09/14/2023. For illustrative purposes only. “US High Yield Option-Adjusted Spread” is entirely composed of the ICE BofA US Option-Adjusted Spread (OASs) which are the calculated spreads between a computed OAS index of all bonds in a given rating category and a spot Treasury curve.

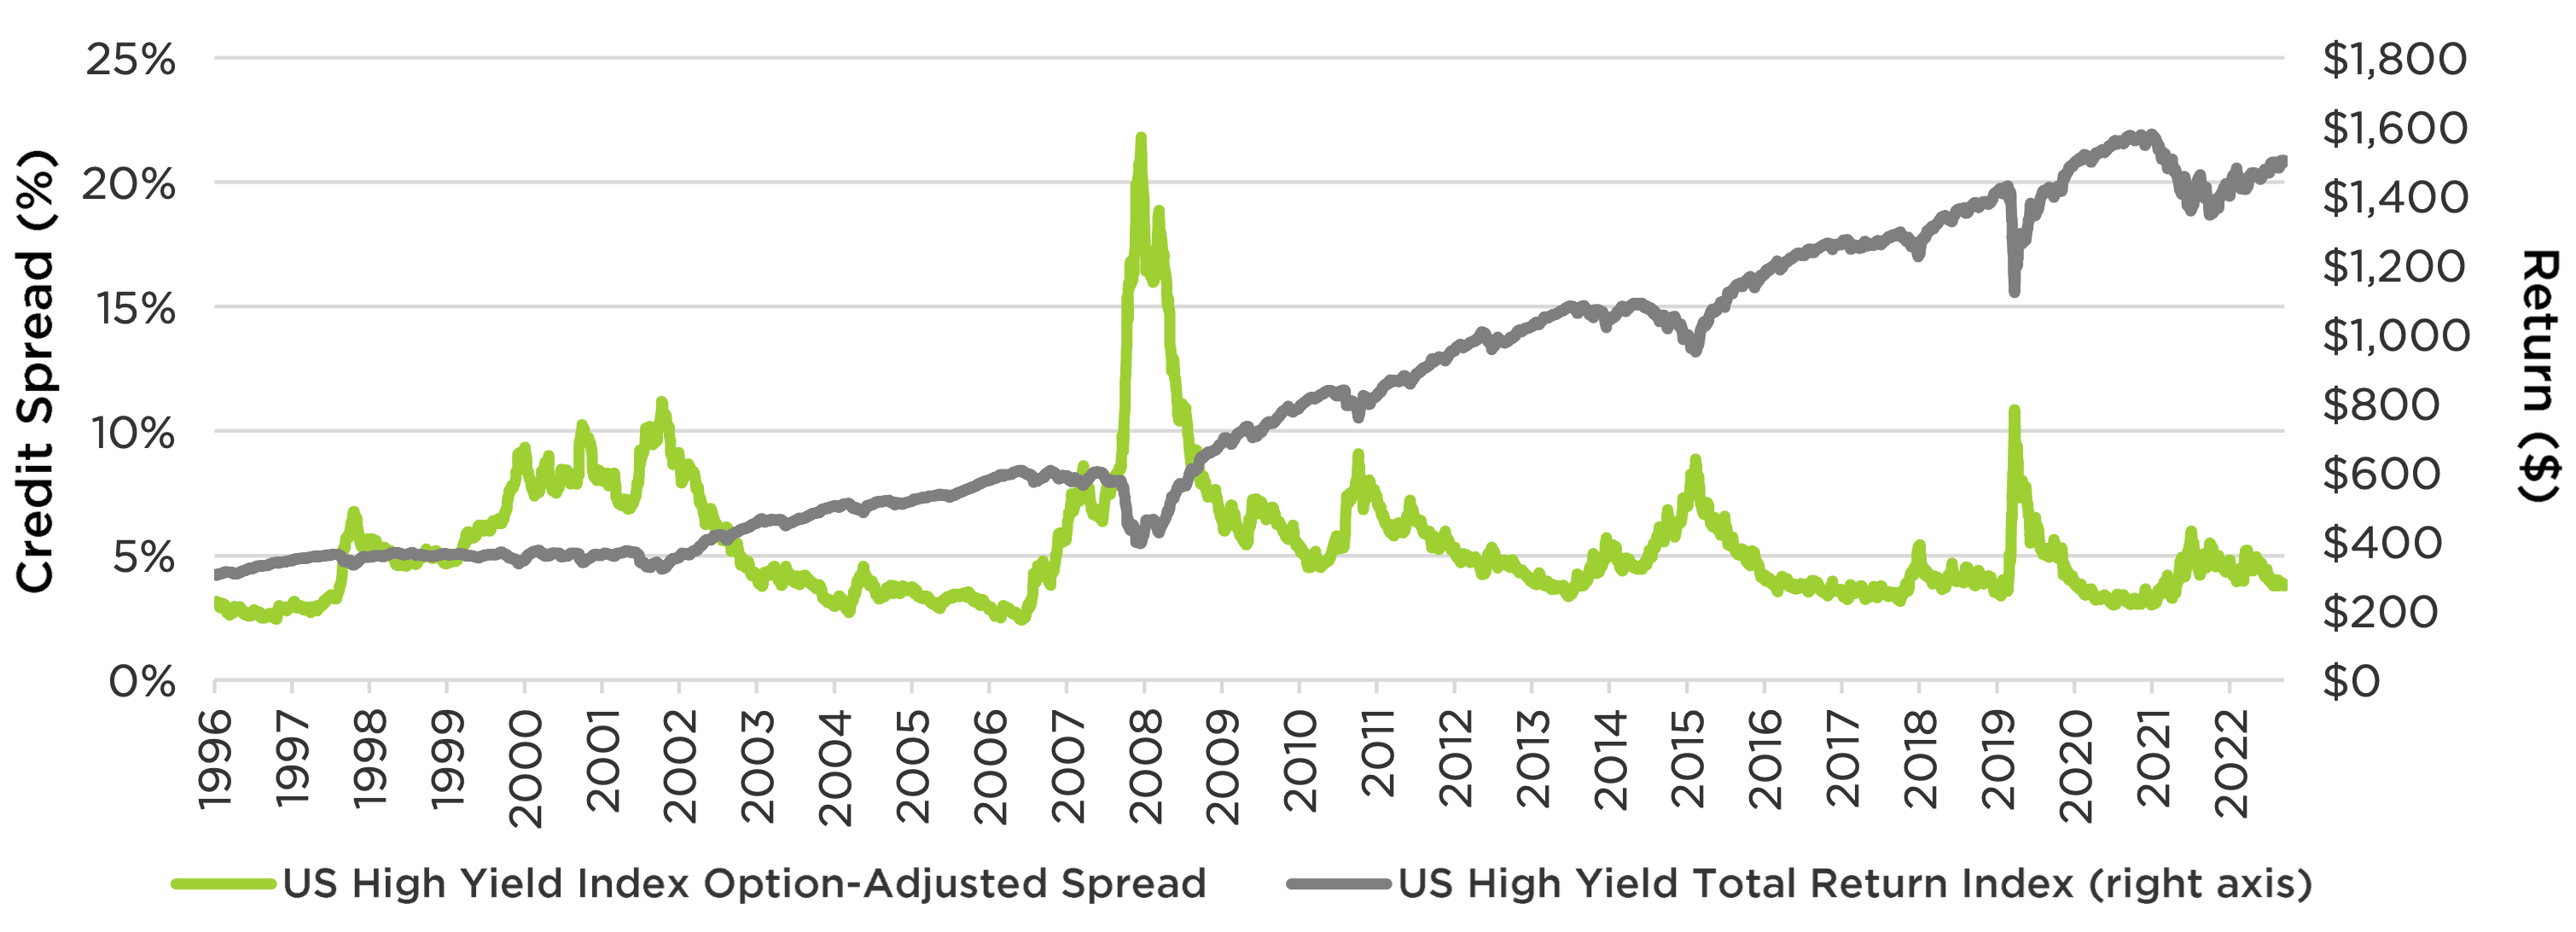
Narrower spreads mean investors earn less return for taking on credit risk. And in the past 25 years, we’ve seen some painful spikes in credit spreads that have created meaningful downside for high yield investors.


US High Yield Option-Adjusted Spread & Return: 1996 to Present

US High Yield Option-Adjusted Spread & Return: 1996 to Present
Source: Bloomberg. Time period: 01/01/202023 to 09/14/2023. For illustrative purposes only. The “US High Yield Total Return Index” is entirely composed of the ICE BofA US High Yield Total Return Index.

Quantifying the impact changes in high yield credit spread might have on a client portfolio, listed below are the average daily returns of various asset classes during periods of increasing and decreasing credit spreads.


Average Daily Returns of Various Asset Classes 1996 to Present

Chart: Average Daily Returns of Various Asset Classes 1996 to Present
Table: Average Daily Returns of Various Asset Classes 1996 to Present
Source: Morningstar. Time period: 01/01/1997 to 09/14/2023. All returns are daily returns. For illustrative purposes only. “High Yield Bond Index” and the “3-5 Yr Treasury Index” are entirely composed of the Bloomberg US High Yield Bond Index and Bloomberg 3-5 Year Treasury Index respectively. “Tactical High Yield Strategy” is defined by buying the Bloomberg U.S. Corporate High Yield Index when it closes above its 200-day moving average the prior day. The strategy entirely switches to exposure of the Bloomberg US Treasury 3-5 Year Index when the Bloomberg US High Yield Index closes below its 200-day moving average. One cannot invest directly in an index or category and unmanaged index or category returns do not reflect any fees, expenses, or sales charges.

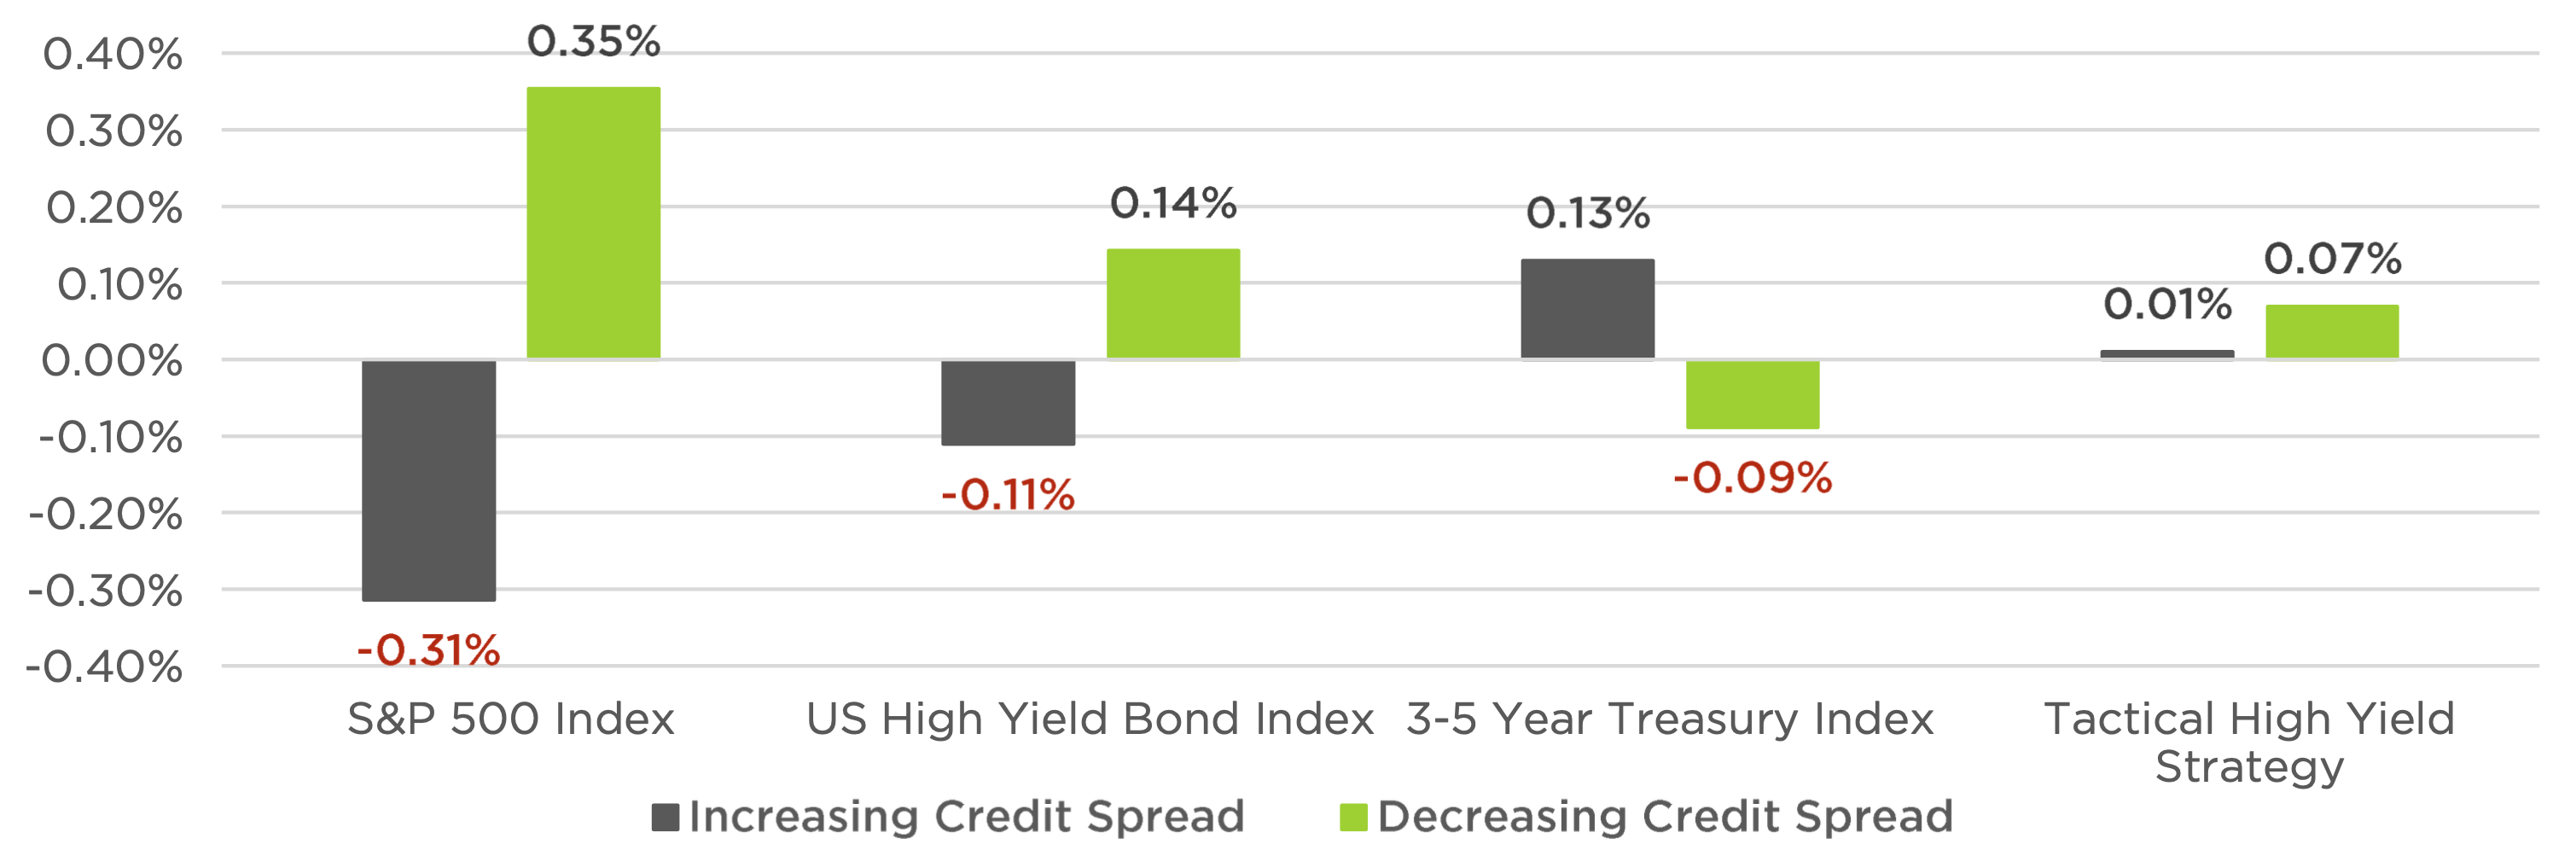
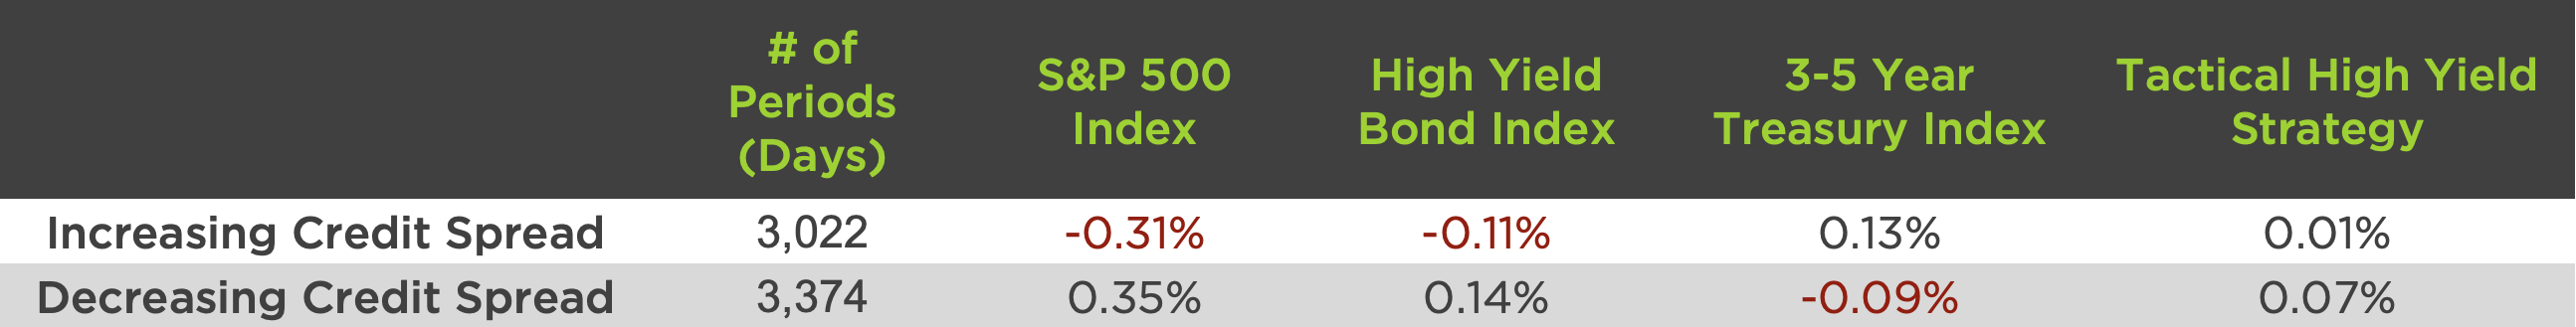
Looking at how investments faired from December of 1996 through September 2023, an increase in the credit spread on average negatively impacted stocks and high yield. Unsurprisingly 3-5 year treasuries were inversely correlated delivering higher average daily returns during periods of rising credit spreads, as they have historically appreciated during periods of market stress. Interestingly a Tactical High Yield Strategy, using a simple 200-day moving average to go from 100% invested in High Yield to 100% invested in 3-5 Year Treasuries when risk-off, fared a bit better delivering an average daily return of 1 bps during periods of increasing credit spreads. Even though average returns of the Tactical strategy during periods of decreasing credit spreads were lower than those of the High Yield Bond Index, the strategy historically has delivered High-Yield like returns over the long run due to the significant removal of downside volatility.


How the Current Credit Spread Environment Applies Today

Some investors are seeking the apparent safety of shorter-term Treasuries, CDs, and similar investments, and some others are betting that a recession may prompt a lowering of interest rates, giving a boost to longer-term high quality bonds. Those ideas could play out well or poorly in the near term; all can see from historical analysis is that high yield credit spreads aren’t a good predictor of the future for high yield bond investments.

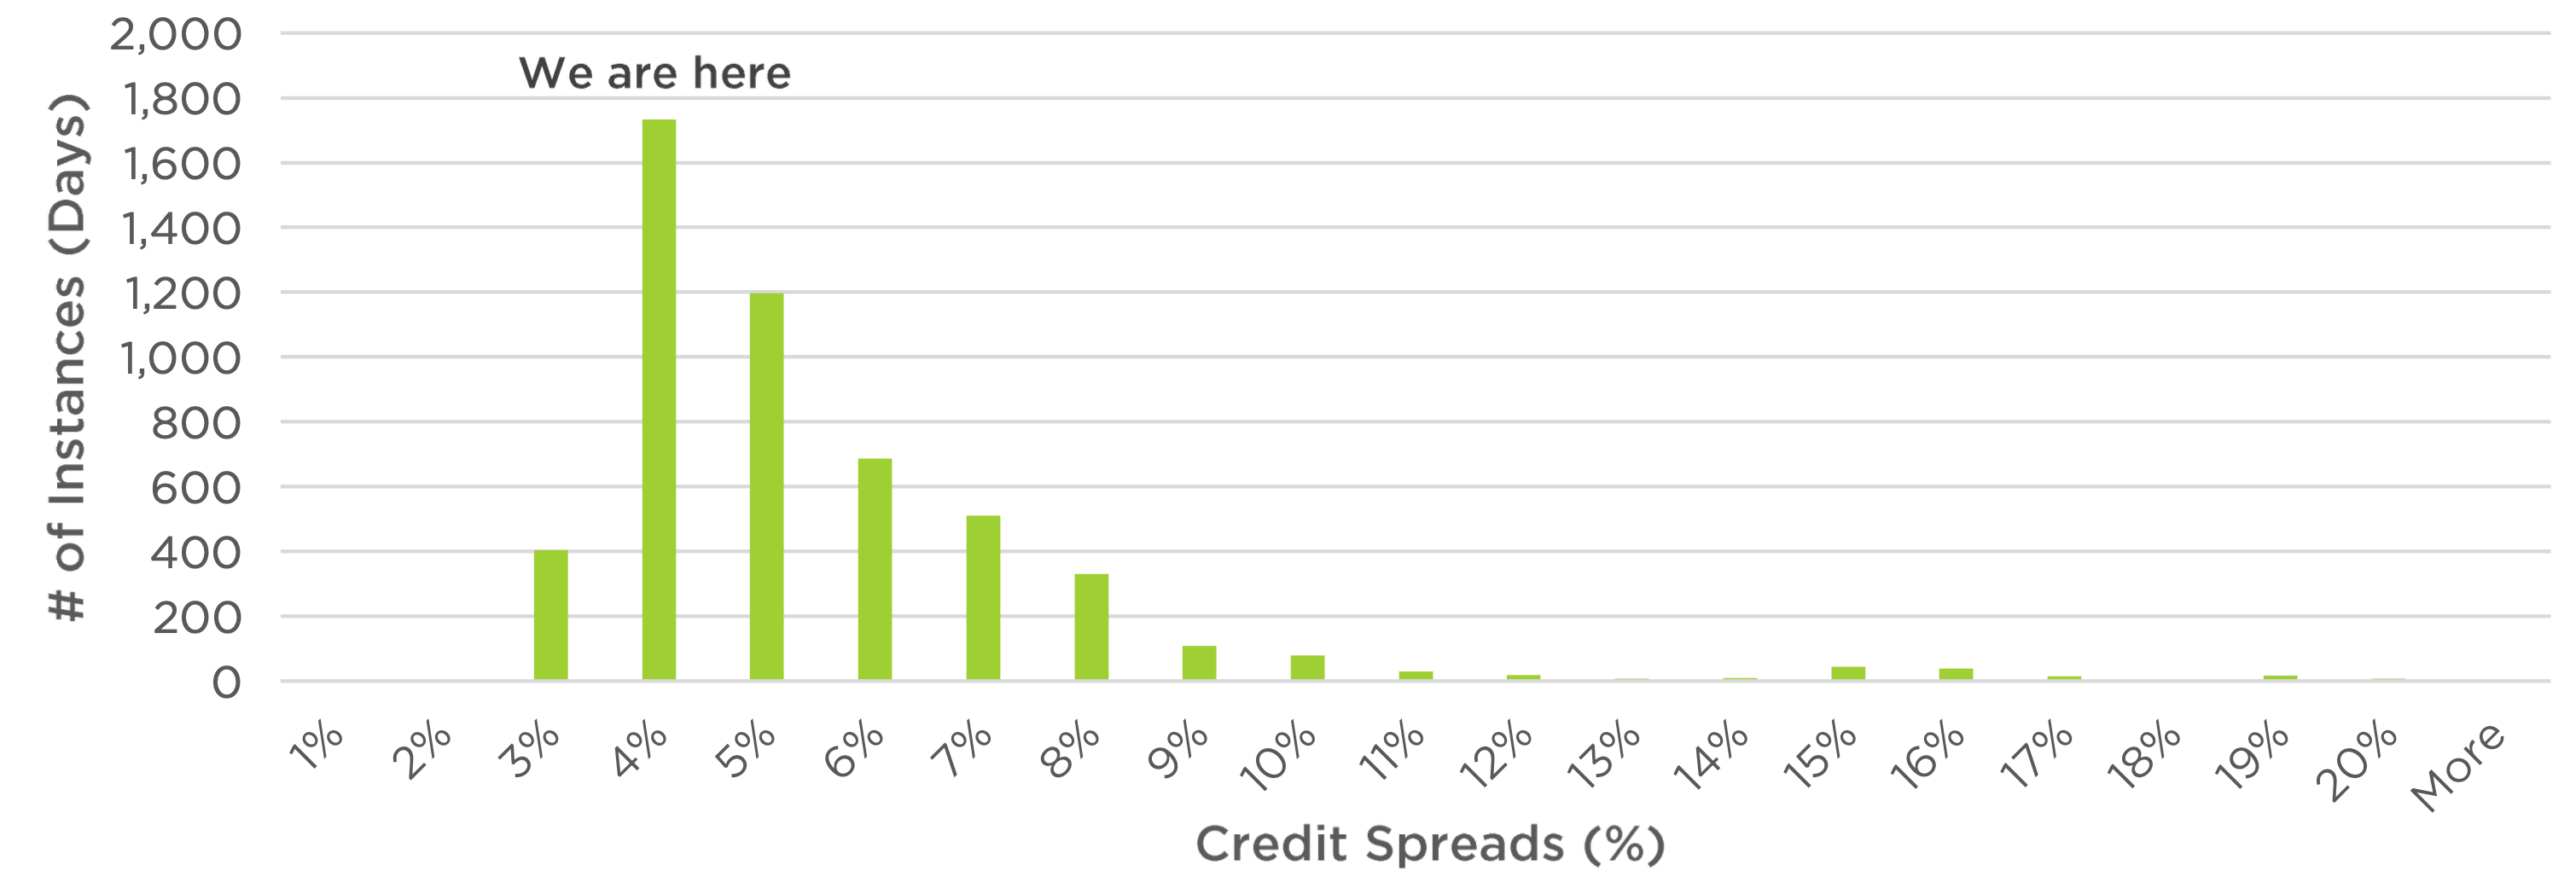
And anyway, although they’ve narrowed a bit this year, high yield credit spreads aren’t all that unusually low. The below chart represents how often high yield spreads have been within a certain range. We are at roughly the peak of the distribution – historically speaking, spreads aren’t overly wide or overly narrow, despite how it may feel in the current environment.


Histogram of the US High Yield Credit Spread: 9/17/2002 – 8/17/2023

Histogram of the US High Yield Credit Spread: 9/17/2002 – 8/17/2023
Source: Bloomberg. Time period: 9/19/2002 to 08/17/2023. For illustrative purposes only.

That’s not a prediction. It doesn’t mean credit spreads can’t widen here, or that this is a particularly “safe” period for high yield. But it does offer some perspective.


Conclusion

Over the past couple decades, there has been a relationship between current spreads and how they change in the short term. But that relationship is cleanest when credit spreads are wide – in those cases they tend to drift downward. The data is much noisier on the left-hand side of the chart when spreads are narrower – and where we are today. Trying to time near-term moves in high yield bonds by looking at current credit spreads (or recent changes in credit spreads) doesn’t seem very well justified by historical data.

One-way investors can manage credit risk (and possible volatility in high yield credit spreads) is to use a systematic risk management strategy with a strong historical track record of mitigating portfolio downside risk. While Tactical High Yield offered lower average returns, if these returns are persistently positive, the strategy can potentially reduce the damaging impact credit spreads can have on a portfolio and help drive compounding returns over the long-run.

Register for our upcoming live-webinar event:

The Counterpoint Fall 2023 Fixed Income Update

Tuesday, November 7th
11:00 AM – 12:00 PM PST | 2:00 PM – 3:00 PM EST

There is no guarantee that any investment strategy will achieve its objectives, generate profits or avoid losses. This information is for use with concurrent or prior delivery of a fund prospectus. Investors should carefully consider the investment objectives, risks, charges and expenses of the funds managed by Counterpoint Mutual Funds. This and other important information about the funds are available in their prospectuses, which can be obtained at counterpointfunds.com or by calling 844-273-8637. The prospectuses should be read carefully before investing. The Counterpoint Mutual Funds fund family is distributed by Northern Lights Distributors, LLC member FINRA/SIPC. Counterpoint Mutual Funds, LLC is not affiliated with Northern Lights Distributors, LLC member FINRA/SIPC.


Important Risk Information

Mutual Funds involve risk including the possible loss of principal. The use of leverage by the Fund or an Underlying Fund, such as borrowing money to purchase securities or the use of derivatives, will indirectly cause the Fund to incur additional expenses and magnify the Fund’s gains or losses. Derivative instruments involve risks different from, or possibly greater than, the risks associated with investing directly in securities and other traditional investments. There is a risk that issuers and counterparties will not make payments on securities and other investments held by the Fund, resulting in losses to the Fund. Past performance is no guarantee of future results. There is no assurance the Fund will meet their stated objectives.

Investments cannot be made in an index. Unmanaged index returns do not reflect any fees, expenses, or sales charges. Past performance is no guarantee of future results. There is no guarantee that any investment will achieve its objectives, generate positive returns, or avoid losses. The Adviser’s reliance on its strategy and judgments about the attractiveness, value and potential appreciation of particular securities and the tactical allocation among investments may prove to be incorrect and may not produce the desired results. No level of diversification can ensure profits or guarantee against loss.

The indices shown above are for informational purposes only and are not reflective of any investment. It is not possible to invest in an index. The data shown does not reflect or compare features of an actual investment, such as its objectives, costs and expenses, liquidity, safety, guarantees or insurance, fluctuation of principal or return, or tax features. Past performance is no guarantee of future results.

Index Definitions

The US High Yield Option-Adjusted Spread is entirely composed of the ICE BofA US Option-Adjusted Spread (OASs) are the calculated spreads between a computed OAS index of all bonds in a given rating category and a spot Treasury curve. An OAS index is constructed using each constituent bond’s OAS, weighted by market capitalization. The S&P 500 Index includes 500 leading companies in leading industries of the U.S. economy and is a proxy for the total stock market. The Bloomberg U.S. Corporate High Yield Index is an unmanaged, U.S. dollar– denominated, nonconvertible, non-investment-grade debt index. The index consists of domestic and corporate bonds rated Ba and below with a minimum outstanding amount of $150 million. The 3-5 Year Treasury Index is completely composed of the Bloomberg US Treasury 3-5 Year Index, which measures US dollar-denominated, fixed-rate, nominal debt issued by the US Treasury with 3-4.9999 years to maturity. The Tactical High Yield Strategy is defined by buying the Bloomberg US High Yield Index when it closes above its 200-day moving average the prior day. The strategy entirely switches to exposure of the Bloomberg US Treasury 3-5 Year Index when the Bloomberg US High Yield Index closes below its 200-day moving average.

Definitions

Return is the percentage change in the value of an investment, and/or cash flows which the investor receives from that investment, such as interest payments, coupons, cash dividends, stock dividends or the payoff from a derivative or structured product, over a specified time period.

Option Adjusted Spread (OAS) is the measurement of the spread of a fixed-income security rate and the risk-free rate of return, which is then adjusted to take into account an embedded option. Typically, an analyst uses Treasury yields for the risk-free rate. The spread is added to the fixed-income security price to make the risk-free bond price the same as the bond.

7753-NLD 09/22/2023

Recent Perspectives

Factor Strategies March to a Different Beat

Many investors agree: Active strategies that try to beat the stock market have periods where they perform well (contributing to outperformance) and periods where they perform poorly (contributing...

READ MORE

Mutual Funds involve risk including the possible loss of principal. Investors should carefully consider the investment objectives, risks, charges and expenses of the funds managed by Counterpoint Funds. This and other important information about the funds is available in their prospectuses, which can be obtained at counterpointfunds.com or by calling 844-273-8637. The prospectuses should be read carefully before investing. The Counterpoint Funds fund family is distributed by Northern Lights Distributors, LLC member FINRA/SIPC. To reach the Counterpoint sales team, please refer to our contact page.

5516-NLD-09/01/2021


Thank you!

We’ve received your request for the featured event collateral. A Counterpoint Funds team member will be in touch shortly.

Subscribe to stay up to date on and receive our monthly perspective.

Thank you!

We’ve received your meeting request and a Counterpoint Funds team member will be in touch shortly.

Subscribe to stay up to date on and receive our monthly perspective.

Thank you!

We’ve received your event registration request and will be in touch shortly.

Subscribe to stay up to date on Counterpoint Funds and receive our monthly perspective.

Thank you!

We have received your application and look forward to reviewing your qualifications for the role. If your application seems like a good fit, we will contact you to discuss next steps.

Thank you again for your application and interest in joining the Counterpoint team!

Thank you!

We’ve received your message. A Counterpoint Funds team member will contact you soon.

Subscribe to stay up to date and receive our monthly perspective.