The term “bubble” is great for describing investment environments where enthusiasm and speculation dominate over longer-term fundamentals. Here’s how financial bubbles, the kind investors play with, are similar to soap bubbles, the kind children play with. Both are:
- Fragile – soap bubbles and financial bubbles run the risk of popping at any minute.
- Empty – the space they take up does not correspond to their substance; they’re made of almost nothing – thin layers of soap or enthusiasm.
- Unpredictable – they both float around slowly but chaotically, and although their eventual breakdown is more or less assured, when or how it may happen is difficult-to-impossible to forecast.
- Fun! – soap bubbles can occupy a toddler for hours; financial bubbles can occupy speculators for years.
But the term “bubble” isn’t perfect because it implies simplicity. This is true for soap bubbles. They emerge whenever a child blows on a plastic wand. Financial bubbles are not so simple: They can emerge in multiple ways, and investors need to analyze them from multiple points of view.
Financial Bubbles’ Two Main Parts
Unlike simple, fun soap bubbles, financial bubbles generally have two main drivers. Either one can create or sustain a bubble by itself, or both can come together:
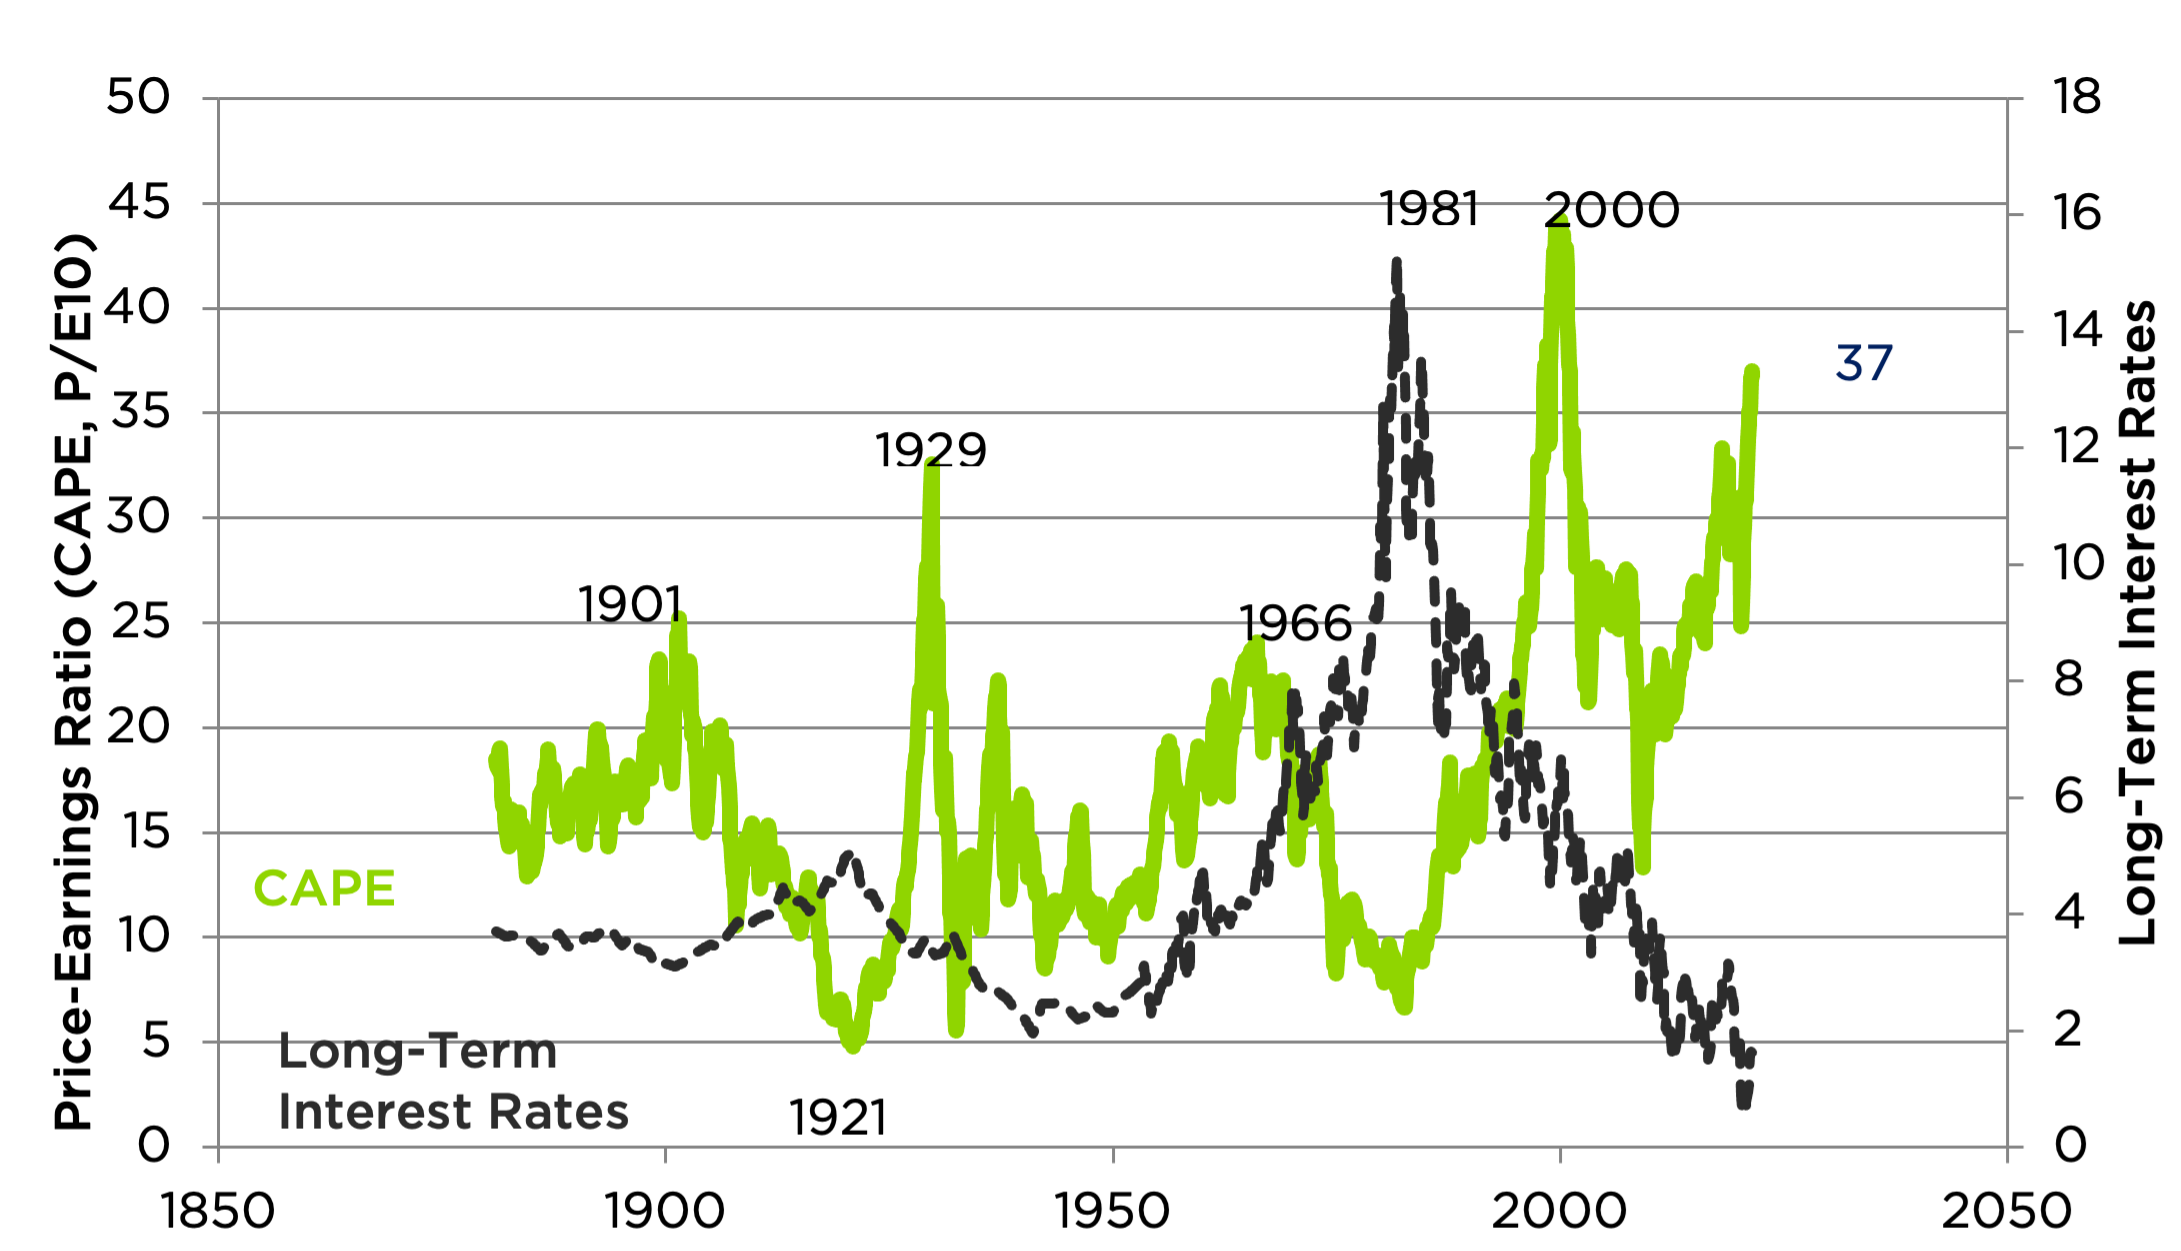
- Broad valuation – how expensive the entire asset class (such as the stock market, or high yield bonds, or the housing market) is relative to its economic value/earnings potential.
- Cross-sectional dislocations – what’s going on under the hood? Is a single hot sector (like technology) driven by emotion and speculation, while less glamorous areas are underappreciated? Are investors piling into narratives like innovation rather than rationally assessing investments’ potential?
Factor Scoreboard: North America, Jan 2020-Feb 2021
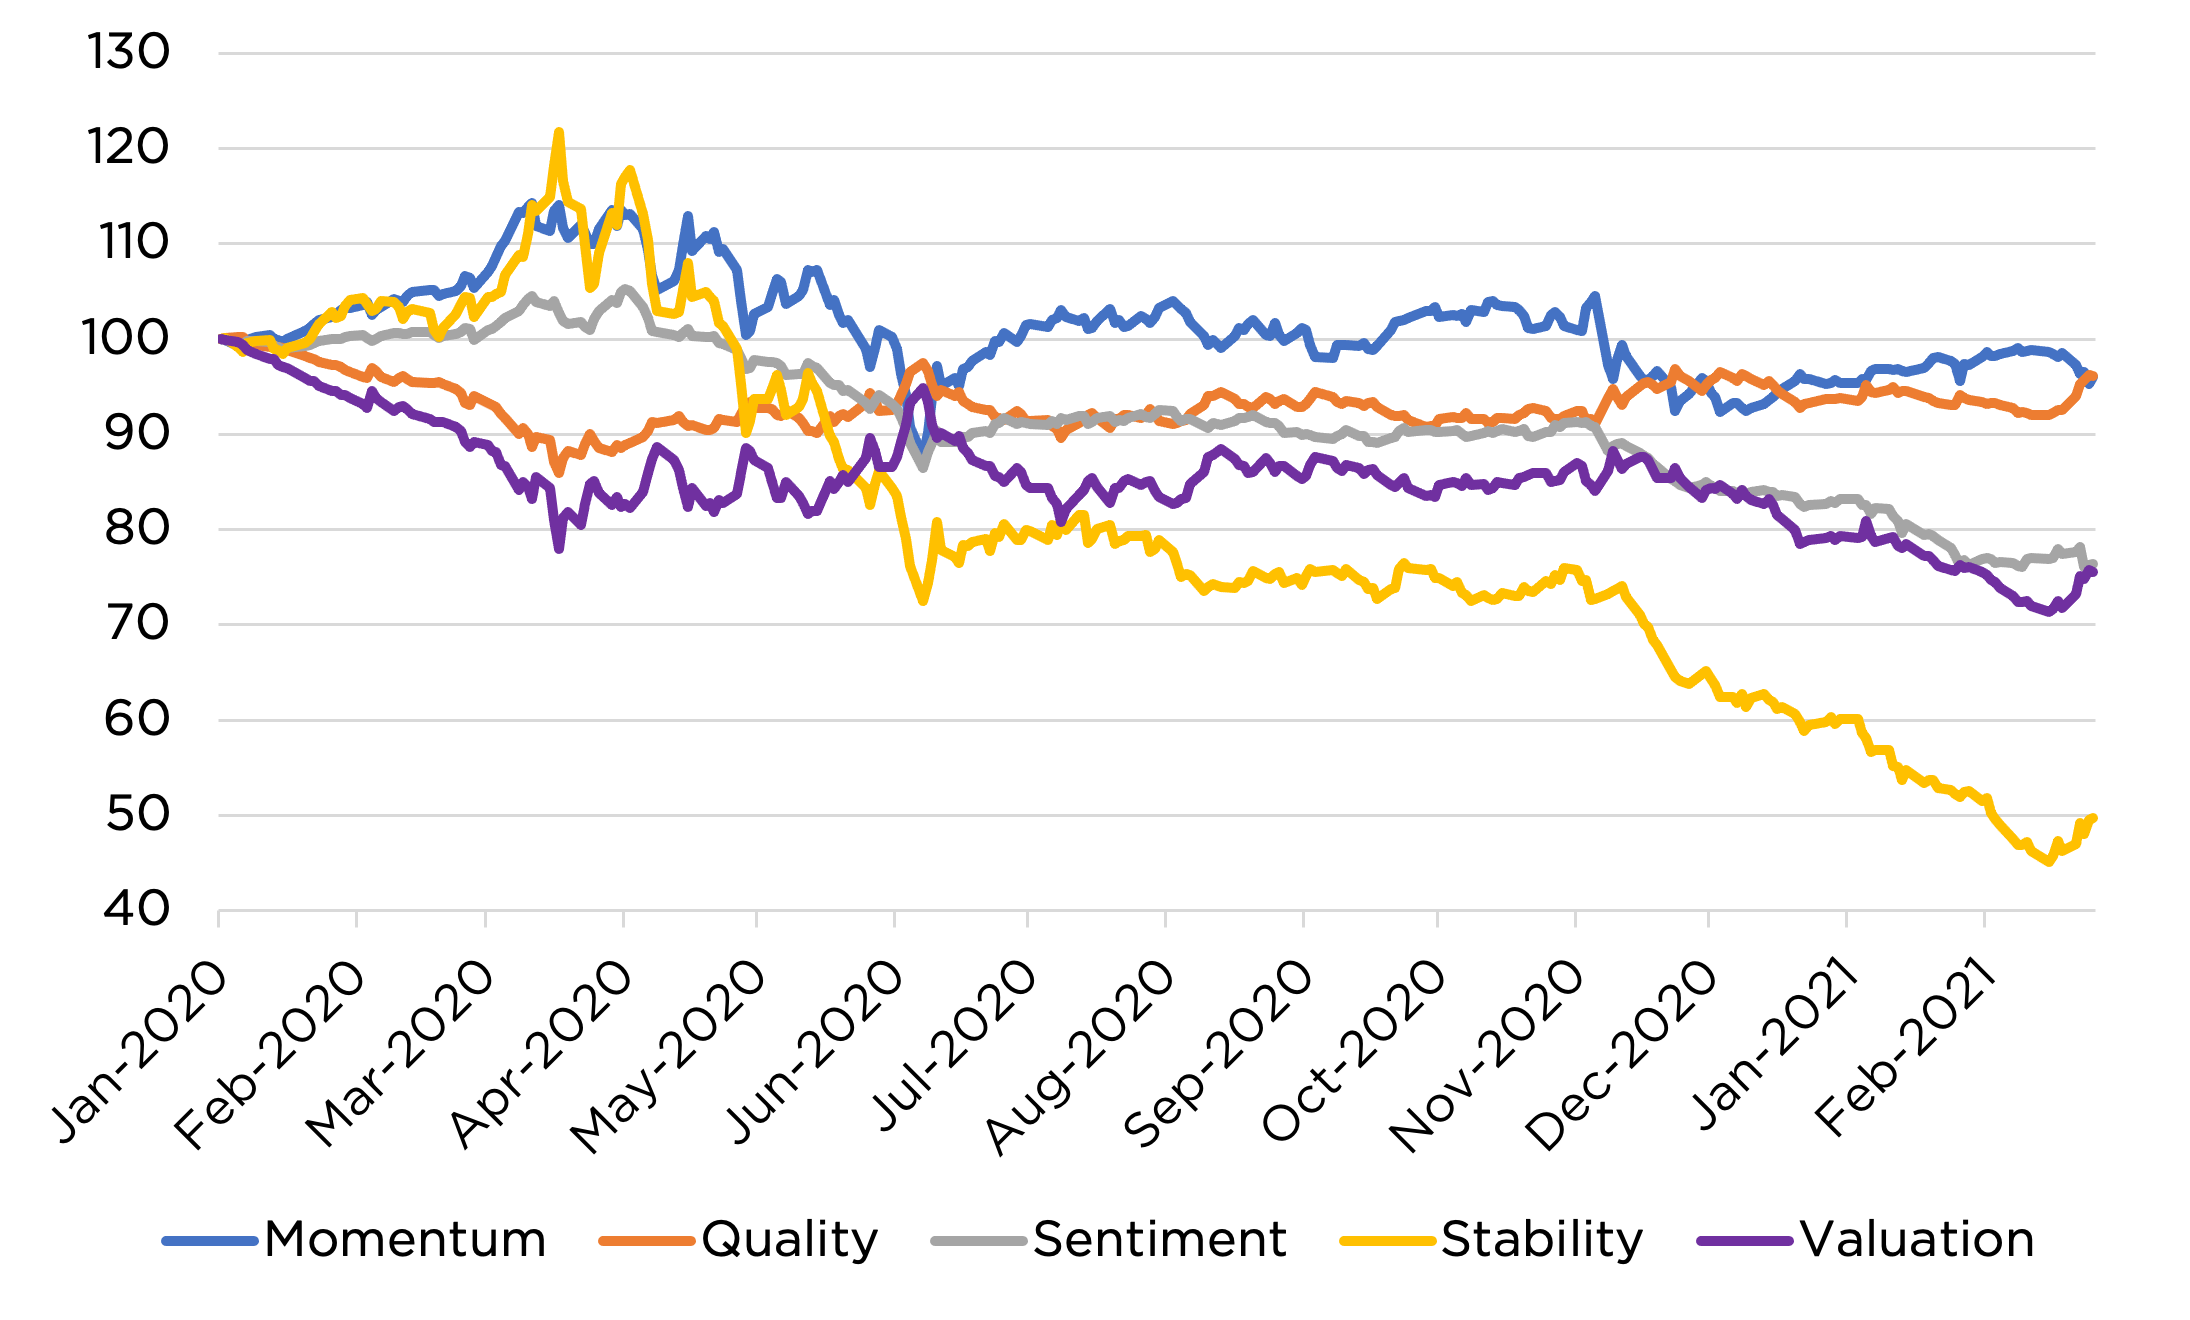 Source: Counterpoint Mutual Funds. The above factor returns are grouped by quintiles. The 1st quintile (Q1) represents the average daily return of the lowest 20% ranking companies. The 5th quintile (Q5) represents the average periodic return for the top 20% ranking companies within the same category. Q5-Q1 is the periodic return to a theoretical portfolio that is long all of the top ranked companies and short the lowest ranked companies within the category. These return calculations assume no transaction costs or market frictions. These returns do not represent the returns of the Funds’ models. They represent raw factor category returns, and are unoptimized long-short returns determined with no consideration of market beta or industry exposure. Prolonged negative returns to investment factors such as valuation, quality, momentum, stability, and valuation may indicate cross-sectional dislocation.
The two usually go together: Some section of the market such as housing or technology may create a narrative that draws investors in, which creates broad-based enthusiasm for an entire asset class. But they don’t have to end simultaneously. For example, the stock market can fall while apparent dislocations remain in place; dislocations can resolve without the stock market falling.
Managing Bubbles’ Risks
Because bubbles are complicated, it can be helpful to have risk-management strategies that account for both bubble drivers – broad valuation and cross-sectional dislocation. Counterpoint Mutual Funds deploys two separate risk-management strategies. Each is directly applicable to a driver of financial bubbles:
- Tactical trend following – when a bubble driven by broad valuation pops, usually the entire asset class enters a pronounced downtrend. Counterpoint Mutual Funds applies tactical trend following across all its strategies.
- Multifactor equity – cross-sectional dislocations are driven by investors ignoring long-term data that explains why stocks tend to perform relatively well or relatively poorly. Multifactor equity has a specific objective to avoid (or potentially profit from) those mistakes. It is a key component to the Counterpoint Tactical Equity strategy.
Conclusion
Unlike their soapy namesakes, financial bubbles have a lot going on beneath the surface. They can be driven by broad-based overenthusiasm for an asset class, pockets of emotional behavior within the market, or both. Although these potential bubble drivers often work together, they don’t have to, so it is worth investing in strategies that are designed to manage each type of bubble risk. Tactical trend following aims specifically at managing downside when broad valuation bubbles pop, and multifactor equity is designed to buffer against cross-sectional dislocations. Deploying both strategies within an investment portfolio has potential to help investors navigate bubble-like environments, whatever may be driving them.