A few weeks of bearish action for high yield indexes and related funds briefly captured market commentators’ imaginations last month. After reaching a high of 1263.99 on Oct. 24, the BofA Merrill Lynch US High Yield Total Return Index dropped 1.5% to a Nov. 15 low of 1244.44. Amid the selloff, investors wondered whether cracks in the high yield uptrend had implications for the broader financial markets.
Before that narrative could take hold, however, high yield returned 1.1% in the next two weeks, recapturing much of the ground it lost to close the month at 1258.15. In the meantime, some trend followers were shaken out, having sold into the brief downturn.
One weakness of a trend-following strategy is the risk of false signals. Trend followers benefit from steadily rising or falling markets. The longer a trend follower is allocated to riskier assets that are in an uptrend, the greater the returns. The longer a trend follower stays risk off during a down trend, the greater the losses avoided.
When an asset’s returns give risk-on and risk-off signals in quick succession, a trend follower risks underperforming a buy-and-hold strategy. Transaction costs increase, as does portfolio churn. In choppy, sideways markets, trend followers often underperform other strategies.
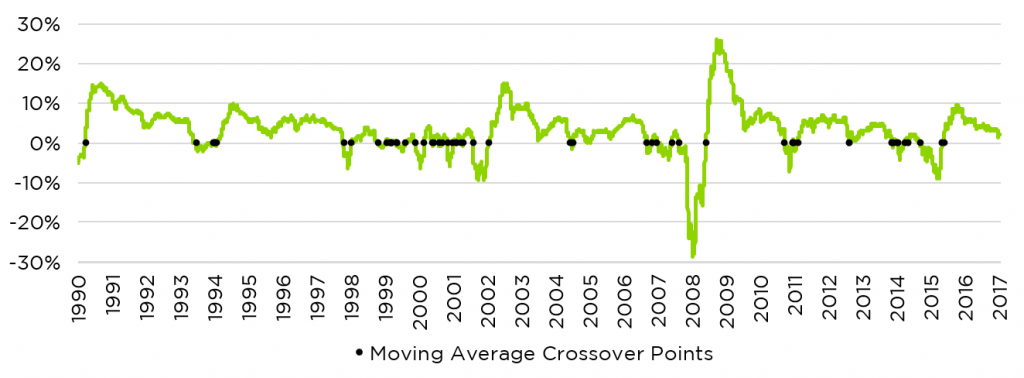
How big is this false signal risk for trend followers? We compared the total returns for the BofA Merrill Lynch High Yield Master II Index to the index’s 200-day moving average from 1990 to today to see how good its risk-on and risk-off signals have been. We must note that the Tactical Income strategy does not use the 200-day moving average, although it does represent the general spirit of our investment approach. The chart below shows high yield’s performance relative to its 200-day moving average.
High Yield in Relation to its 200-Day Total Return Moving Average

We consider a cross above the 200-day moving average to be a risk-on signal of an uptrend, and a cross below the 200-day moving average to be a risk-off signal of a downtrend. Under this rubric, the high yield index gave 65 risk-on or risk-off signals since late 1990.
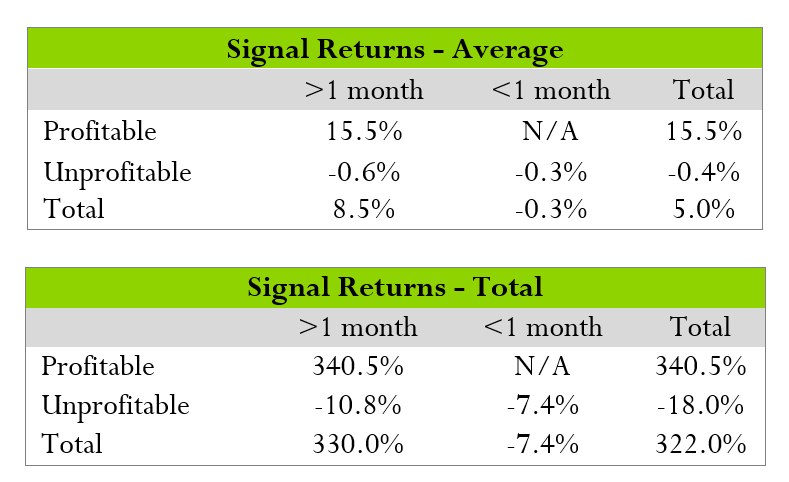
We then divided signals into two sets of categories: those that ended up lasting shorter or longer than one month (22 trading days), and those that were profitable or unprofitable. We considered signals that lost money and lasted less than one month to be “false” signals.

Of the 65 signals given, 26 were “false,” according to this framework. The average return of our high yield trend following strategy after a false signal was -0.3%. In total, trend followers lost 7.4% following these unprofitable short term signals.
Understanding these costs, what were the benefits of the “accurate” signals that lasted more than one month? Accurate long-term risk-on signals delivered average returns of 15.5%, and total returns from accurate risk-on signals were 340.5%.

This basic assessment shows that over the past several decades, trend followers in high yield could expect many “false alarms.” Signals that lasted less than one month were always unprofitable, and they accounted for about 40% of all trend-following signals. However, the benefits of the “accurate” long-term signals that turned up about 33% of the time were substantial. Robust trends lasting more than 1 month produce meaningful opportunities to capture upside as well as avoid losses.
It is important to step back from this sort of quantitative approach and address why results like this are even possible, when so many markets’ anomaly returns are reduced by competition once discovered. This is explained by High Yield’s volatility profile, as is it very regime oriented. It turns out that two-way volatility is the enemy to trend-following strategies.
In good economic times and seemingly stable states of the world, High Yield exhibits a low movement profile akin to a bond. This stable behavior is explained by the fact that it holds a relatively balanced exposure to both credit and interest rate risk, which tend to be negatively correlated. In effect, High Yield as an asset acts like it were a portfolio of stocks and bonds, with each asset class moving in opposite direction to yield a less risky portfolio.
In more seemingly uncertain times High Yield moves like equities. Better yet, during those uncertain periods, High Yield has tended to express more persistent directional trends compared to equity viewed across all time periods.
Understanding a strategy’s strengths and weaknesses is critical to successful implementation. No strategy works well in all environments. Investors should anticipate and plan for developments that appear negative in the short term and remember to place such events in context of the long term benefits and drawbacks of the strategy. Counterpoint Tactical Income Fund continues to privilege careful risk management above other considerations, and we believe that the benefits to our trend following strategy outweigh the drawbacks.