
Three Surprising Risk Management Ideas for 2026
Year-ahead commentary is challenging for us: We don’t have a crystal ball, and we believe predictions contribute more to investment mistakes than outperformance. But the
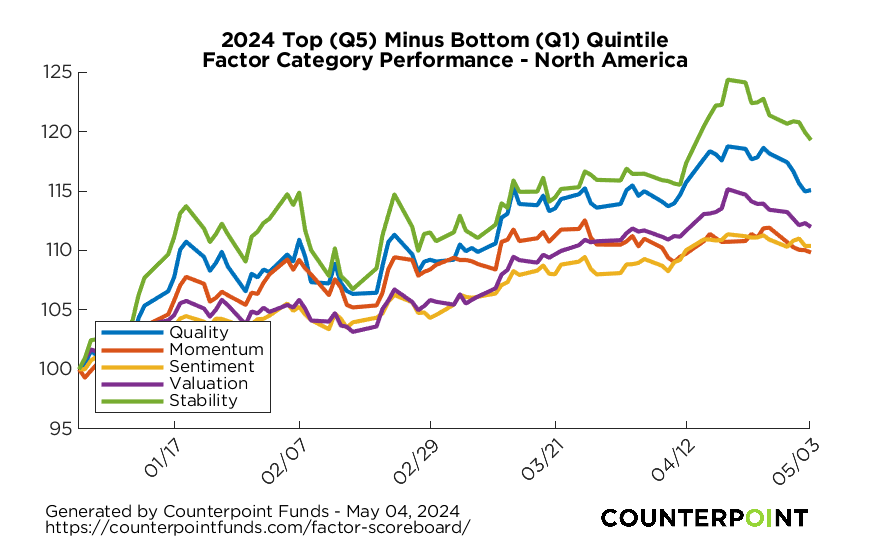
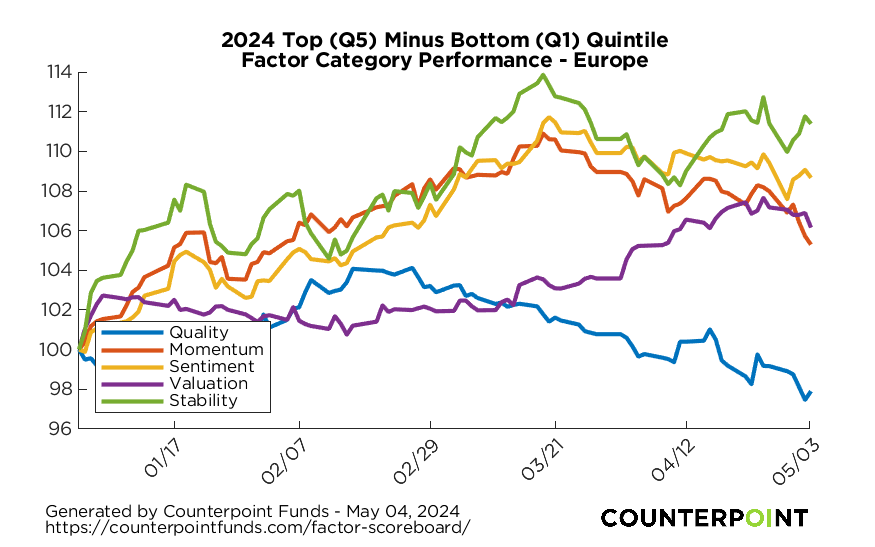
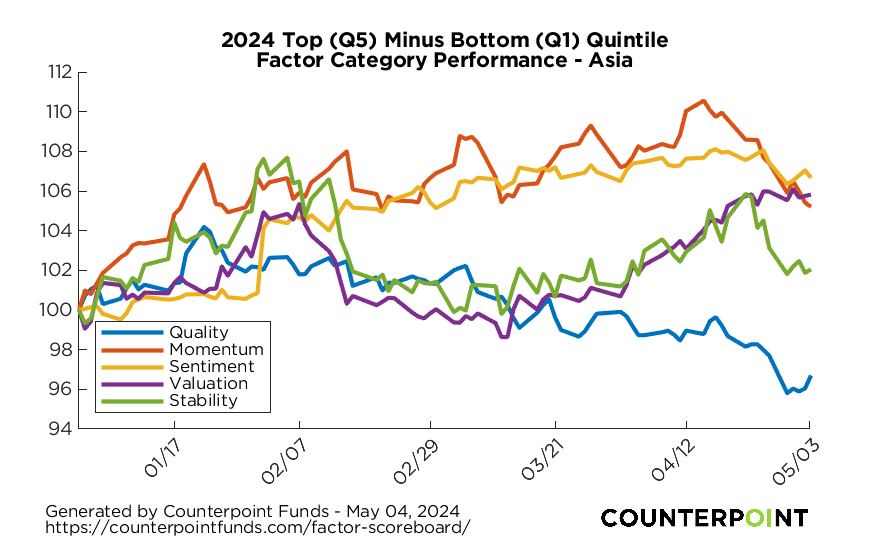
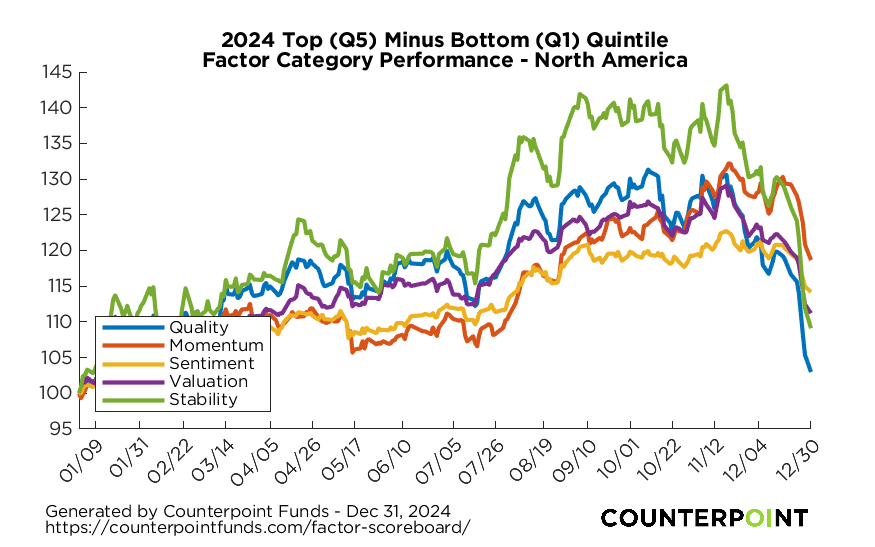
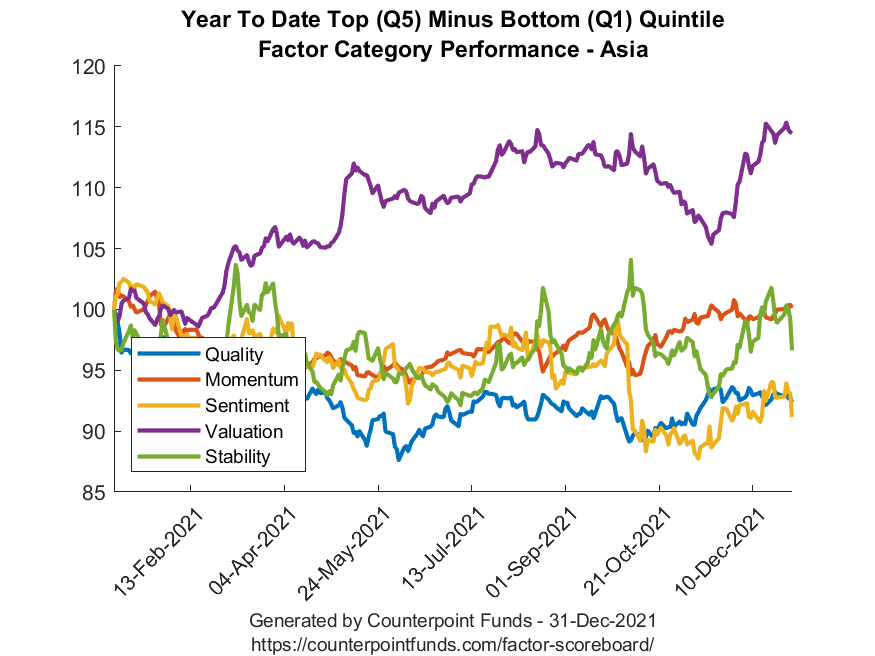
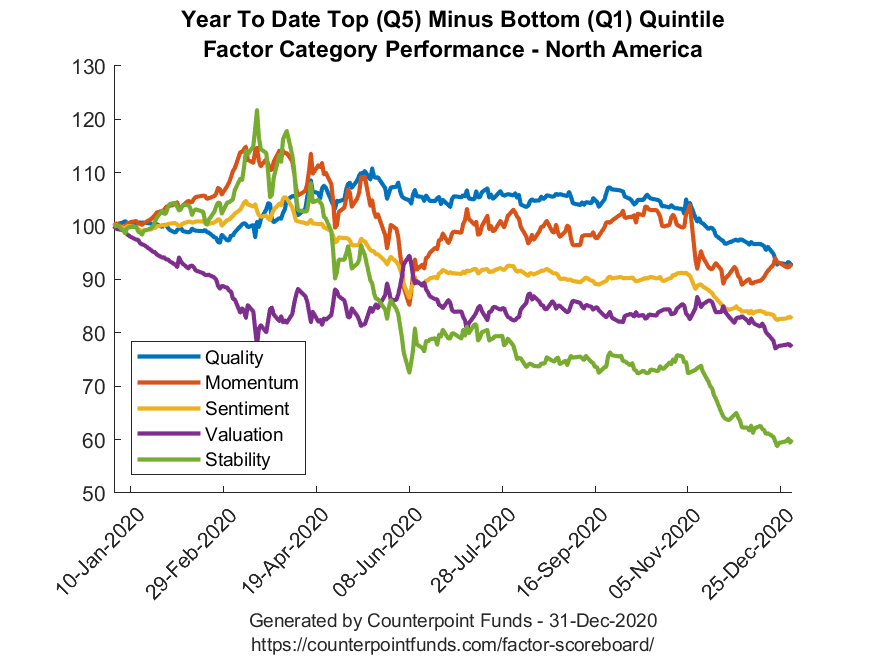
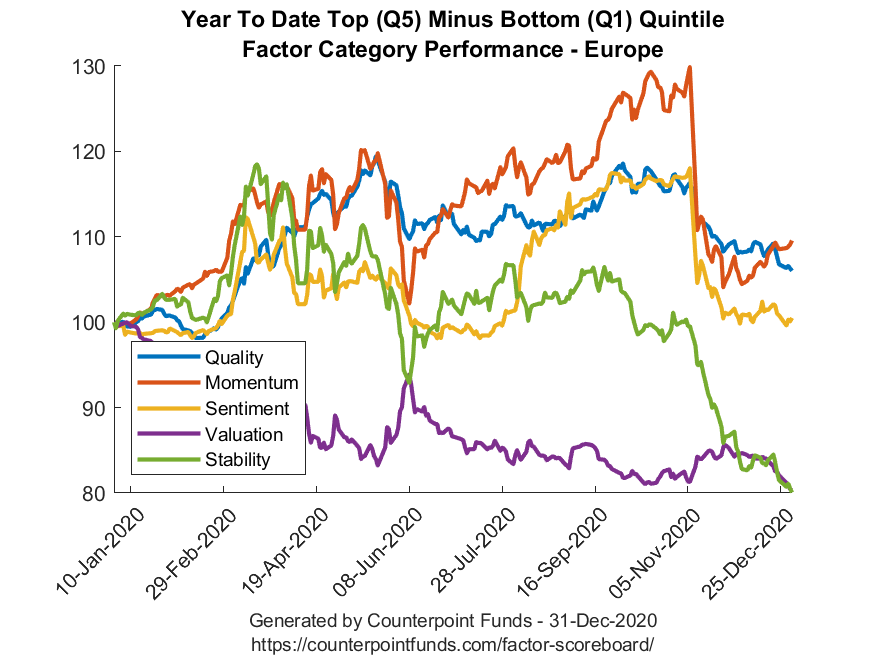
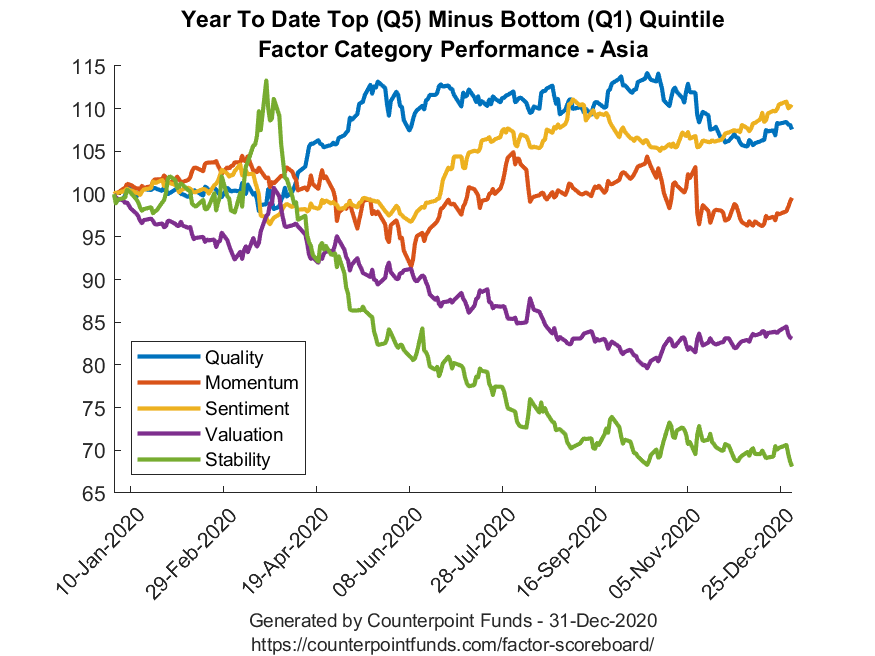
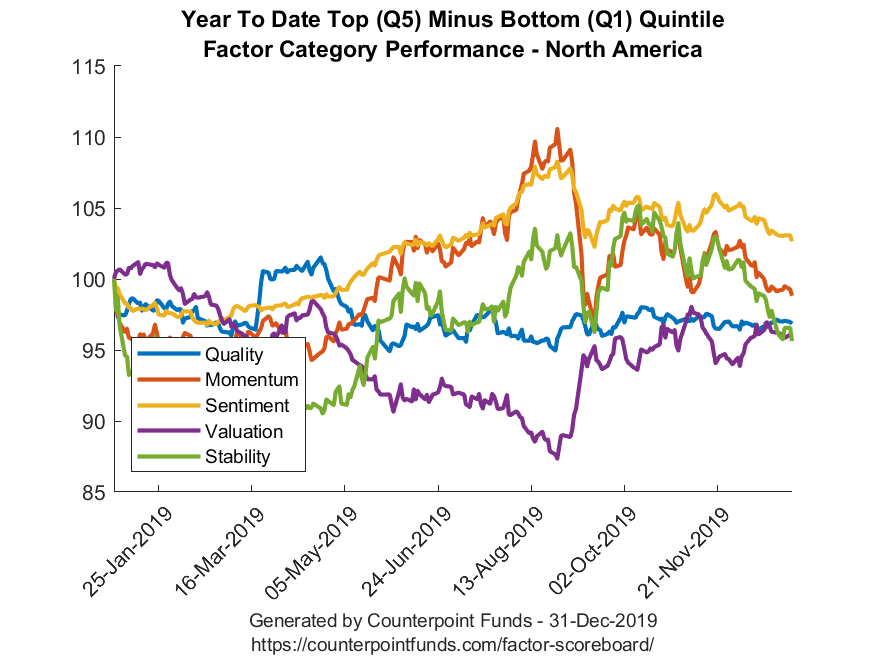
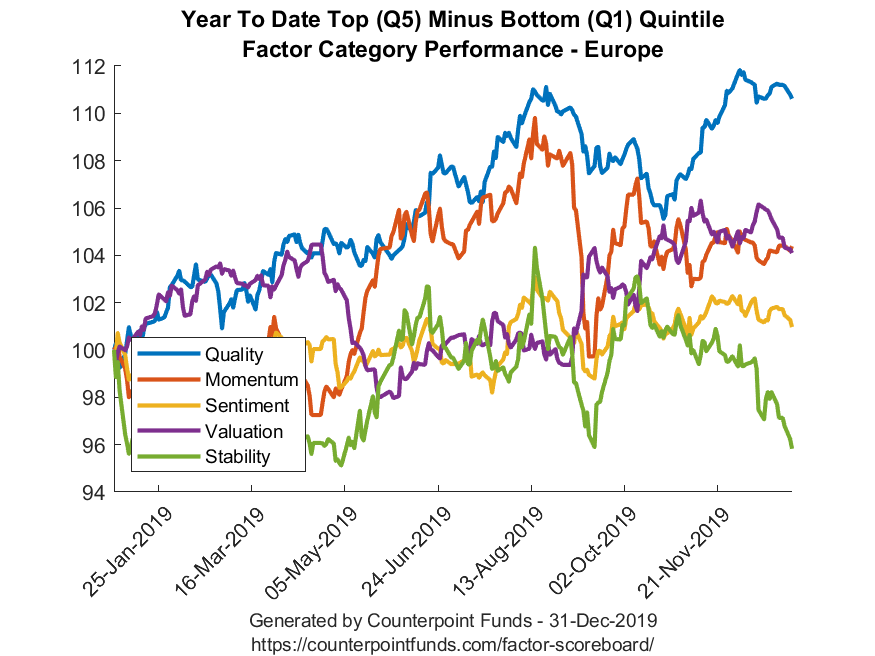
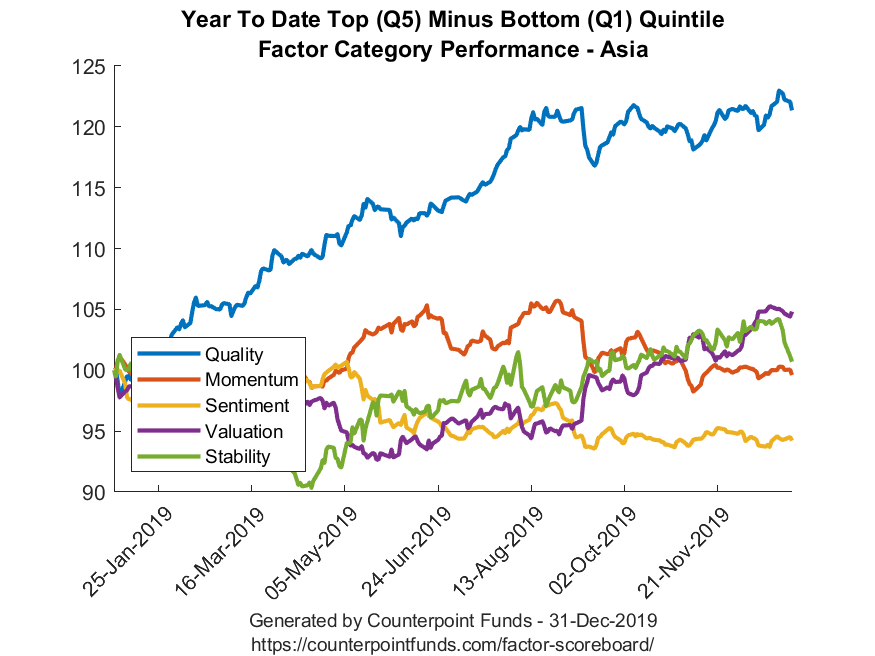
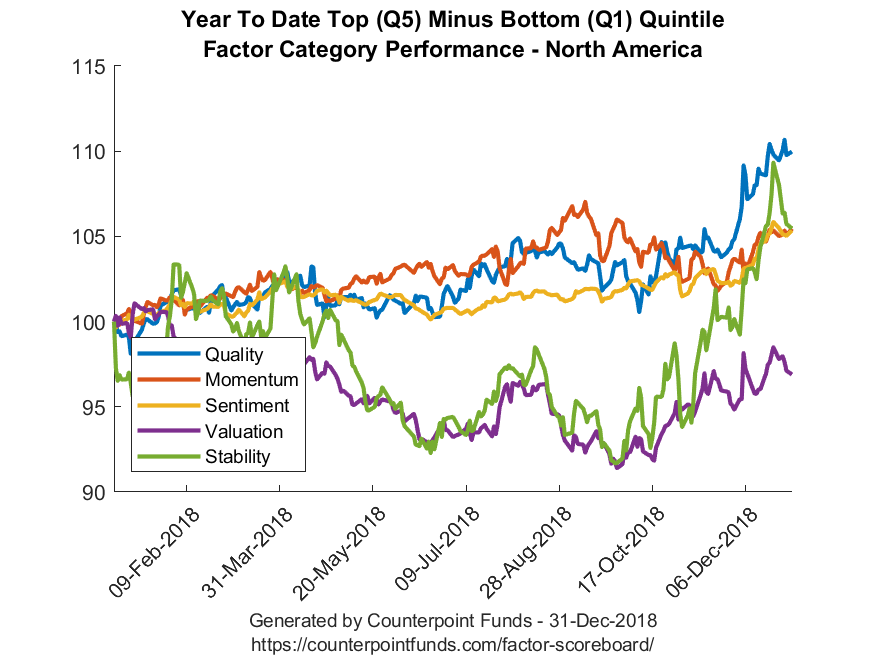
The Factor Scoreboard creates a way for investors to see which factor strategies have been “working” and which are struggling across different geographies. Dramatic underperformance of value factor strategies might indicate a valuation bubble within one market. A negative momentum performance might indicate a sudden shift in direction by the biggest winners or losers of the past months or year.
The factor scoreboard assumes a daily rebalance methodology based on live updating daily cross-sectional scoring to measure the raw performance of a given factor, and is not reflective of any investment. For a market characterized by fast-changing cross sectional ranks, the scoreboard will diverge substantially from slower moving indexes that are usually characterized by monthly, quarterly, or even annual rebalance periods. Those slower moving factor indices often include stale factor rankings in their composition, due to ranks changing between rebalances. Higher decay factors (i.e. momentum) will diverge more substantially from factors with a lower decay rate (i.e. value).
In addition to describing the recent history of particular factor strategies, the Factor Scoreboard can help investors assess what’s taking place in the stock market in terms of long-run historical sources of return. The returns to multi-factor equity strategies can also help investors understand what’s taking place “under the hood” of global equity markets. Many investors believe major factors like value, momentum, and profitability exist because of a fundamental economic or psychological tendency that affects stock prices.
| Quintile 1 (Short) | Quintile 5 (Long) | Q5 – Q1 | |
|---|---|---|---|
| Quality | -0.44% | 4.87% | 5.31% |
| Momentum | -0.76% | 7.14% | 7.90% |
| Sentiment | 3.17% | 5.79% | 2.62% |
| Valuation | 1.73% | 0.40% | -1.33% |
| Stability | 8.24% | 3.99% | -4.25% |
As of 02-13-26 |
|||
| Quintile 1 (Short) | Quintile 5 (Long) | Q5 – Q1 | |
|---|---|---|---|
| Quality | 1.72% | 3.74% | 2.02% |
| Momentum | 2.43% | 6.73% | 4.30% |
| Sentiment | 5.75% | 4.08% | -1.68% |
| Valuation | 5.63% | 3.62% | -2.01% |
| Stability | 10.04% | 2.56% | -7.49% |
As of 02-13-26 |
|||
| Quintile 1 (Short) | Quintile 5 (Long) | Q5 – Q1 | |
|---|---|---|---|
| Quality | 18.91% | 7.43% | -11.49% |
| Momentum | 9.94% | 19.77% | 9.83% |
| Sentiment | 14.36% | 17.43% | 3.07% |
| Valuation | 17.57% | 12.41% | -5.16% |
| Stability | 26.14% | 5.35% | -20.79% |
As of 02-13-26 |
|||
| Quintile 1 (Short) | Quintile 5 (Long) | Q5 – Q1 | |
|---|---|---|---|
| Quality | 2.03% | 1.53% | -0.50% |
| Momentum | 1.97% | 1.76% | -0.21% |
| Sentiment | 1.47% | 1.36% | -0.11% |
| Valuation | 1.75% | 1.17% | -0.58% |
| Stability | 2.28% | 0.69% | -1.59% |
As of 02-13-26 |
|||
| Quintile 1 (Short) | Quintile 5 (Long) | Q5 – Q1 | |
|---|---|---|---|
| Quality | -0.96% | 0.58% | 1.54% |
| Momentum | 0.27% | 0.26% | -0.01% |
| Sentiment | -0.01% | -0.06% | -0.05% |
| Valuation | 0.03% | 0.01% | -0.02% |
| Stability | 0.73% | -0.14% | -0.87% |
As of 02-13-26 |
|||
| Quintile 1 (Short) | Quintile 5 (Long) | Q5 – Q1 | |
|---|---|---|---|
| Quality | -1.29% | -2.11% | -0.82% |
| Momentum | -1.84% | -1.83% | 0.01% |
| Sentiment | -1.15% | -1.47% | -0.32% |
| Valuation | -1.47% | -1.23% | 0.24% |
| Stability | -1.33% | -1.12% | 0.21% |
As of 02-13-26 |
|||
| Quintile 1 (Short) | Quintile 5 (Long) | Q5 – Q1 | |
|---|---|---|---|
| Quality | -3.48% | -0.08% | 3.40% |
| Momentum | -3.57% | -0.28% | 3.29% |
| Sentiment | -3.63% | -0.55% | 3.08% |
| Valuation | -2.90% | -2.65% | 0.25% |
| Stability | -1.68% | -0.31% | 1.37% |
As of 02-13-26 |
|||
| Quintile 1 (Short) | Quintile 5 (Long) | Q5 – Q1 | |
|---|---|---|---|
| Quality | -2.39% | -0.18% | 2.21% |
| Momentum | -0.28% | 0.26% | 0.54% |
| Sentiment | -0.58% | -0.11% | 0.47% |
| Valuation | 0.14% | -0.48% | -0.62% |
| Stability | 0.94% | -0.10% | -1.04% |
As of 02-13-26 |
|||
| Quintile 1 (Short) | Quintile 5 (Long) | Q5 – Q1 | |
|---|---|---|---|
| Quality | 4.70% | 1.14% | -3.56% |
| Momentum | 1.64% | 4.56% | 2.92% |
| Sentiment | 3.45% | 5.15% | 1.70% |
| Valuation | 4.03% | 3.64% | -0.39% |
| Stability | 6.24% | 0.82% | -5.42% |
As of 02-13-26 |
|||
| Quintile 1 (Short) | Quintile 5 (Long) | Q5 – Q1 | |
|---|---|---|---|
| Quality | -8.99% | 0.34% | 9.33% |
| Momentum | -9.07% | 0.38% | 9.45% |
| Sentiment | -4.87% | 0.46% | 5.33% |
| Valuation | -6.49% | -2.60% | 3.89% |
| Stability | -6.93% | 2.07% | 9.00% |
As of 02-13-26 |
|||
| Quintile 1 (Short) | Quintile 5 (Long) | Q5 – Q1 | |
|---|---|---|---|
| Quality | -1.82% | -0.14% | 1.68% |
| Momentum | -0.29% | 0.10% | 0.39% |
| Sentiment | 0.49% | 1.01% | 0.52% |
| Valuation | -0.34% | 0.52% | 0.86% |
| Stability | -0.41% | 1.73% | 2.14% |
As of 02-13-26 |
|||
| Quintile 1 (Short) | Quintile 5 (Long) | Q5 – Q1 | |
|---|---|---|---|
| Quality | 4.51% | -0.78% | -5.29% |
| Momentum | 0.25% | 4.72% | 4.47% |
| Sentiment | 2.47% | 6.62% | 4.15% |
| Valuation | 2.92% | 4.58% | 1.66% |
| Stability | 5.55% | 2.34% | -3.21% |
As of 02-13-26 |
|||

| Quintile 1 (Short) | Quintile 5 (Long) | Q5 – Q1 | |
|---|---|---|---|
| Quality | 5.73% | 15.01% | 9.28% |
| Momentum | 4.37% | 26.87% | 22.50% |
| Sentiment | 3.76% | 21.30% | 17.54% |
| Valuation | 5.36% | 21.26% | 15.90% |
| Stability | 1.04% | 18.95% | 17.91% |
As of 12-31-24 |
|||
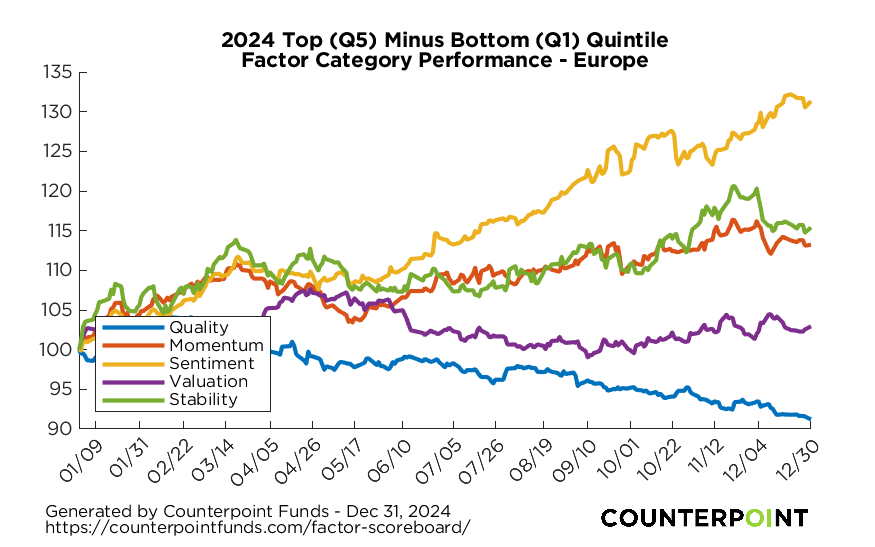
Europe Factor Category Returns
| Quintile 1 (Short) | Quintile 5 (Long) | Q5 – Q1 | |
|---|---|---|---|
| Quality | 14.20% | 4.54% | -9.66% |
| Momentum | -1.03% | 12.42% | 13.46% |
| Sentiment | -15.33% | 12.39% | 27.72% |
| Valuation | 5.97% | 9.51% | 3.54% |
| Stability | -2.82% | 13.20% | 16.02% |
As of 12-31-24 |
|||
Asia Factor Category Returns
| Quintile 1 (Short) | Quintile 5 (Long) | Q5 – Q1 | |
|---|---|---|---|
| Quality | 1.77% | 3.89% | 2.11% |
| Momentum | -4.94% | 5.74% | 10.69% |
| Sentiment | -8.52% | 5.30% | 13.82% |
| Valuation | -4.81% | 8.24% | 13.05% |
| Stability | -6.14% | 9.76% | 15.90% |
As of 12-31-24 |
|||
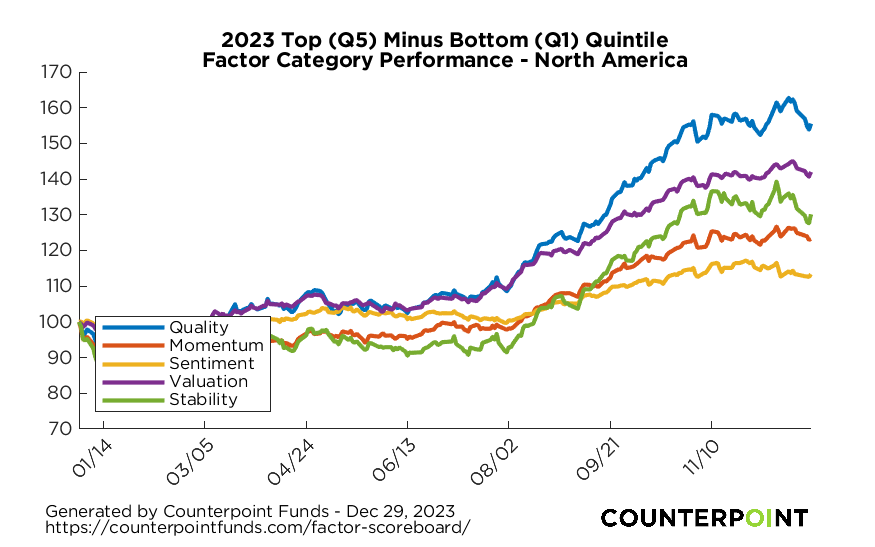
| Quintile 1 (Short) | Quintile 5 (Long) | Q5 – Q1 | |
|---|---|---|---|
| Quality | -23.95% | 22.40% | 46.35% |
| Momentum | -10.19% | 14.08% | 24.27% |
| Sentiment | 1.73% | 17.77% | 16.04% |
| Valuation | -15.72% | 21.62% | 37.34% |
| Stability | -20.61% | 8.46% | 29.07% |
As of 12-29-23 |
|||
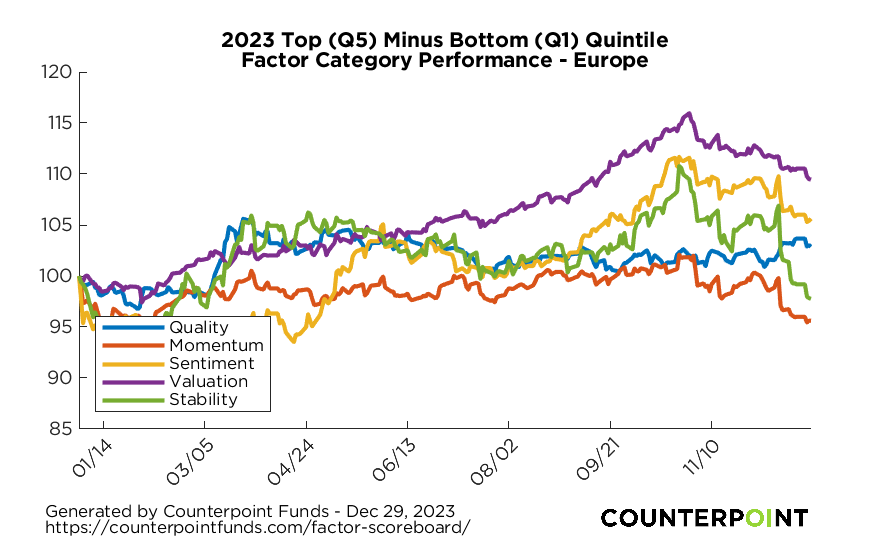
Europe Factor Category Returns
| Quintile 1 (Short) | Quintile 5 (Long) | Q5 – Q1 | |
|---|---|---|---|
| Quality | 11.56% | 15.45% | 3.89% |
| Momentum | 13.08% | 9.14% | -3.94% |
| Sentiment | 24.57% | 16.16% | -8.41% |
| Valuation | 6.63% | 17.30% | 10.67% |
| Stability | 27.56% | 10.75% | -16.81% |
As of 12-29-23 |
|||
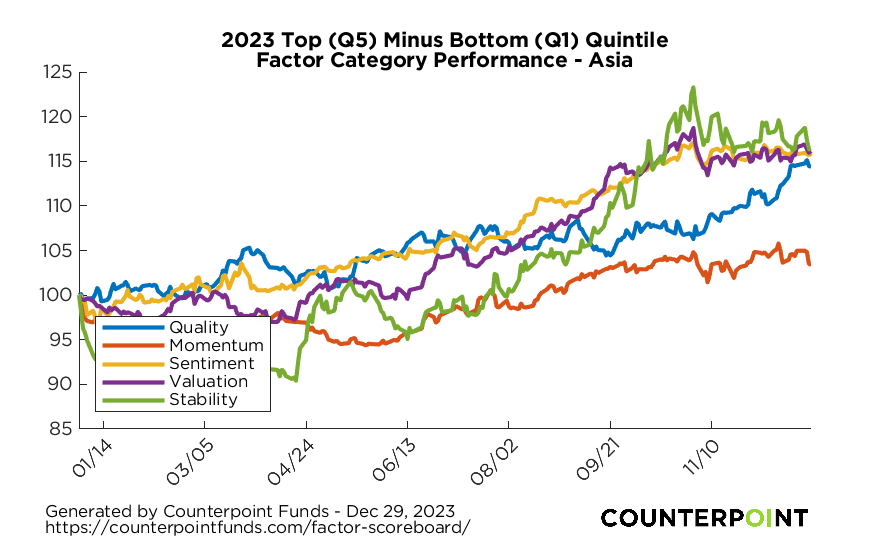
Asia Factor Category Returns
| Quintile 1 (Short) | Quintile 5 (Long) | Q5 – Q1 | |
|---|---|---|---|
| Quality | -0.52% | 14.08% | 14.61% |
| Momentum | 4.13% | 8.23% | 4.10% |
| Sentiment | 5.86% | 23.36% | 17.50% |
| Valuation | 1.93% | 19.11% | 17.19% |
| Stability | 1.21% | 20.42% | 19.21% |
As of 12-29-23 |
|||
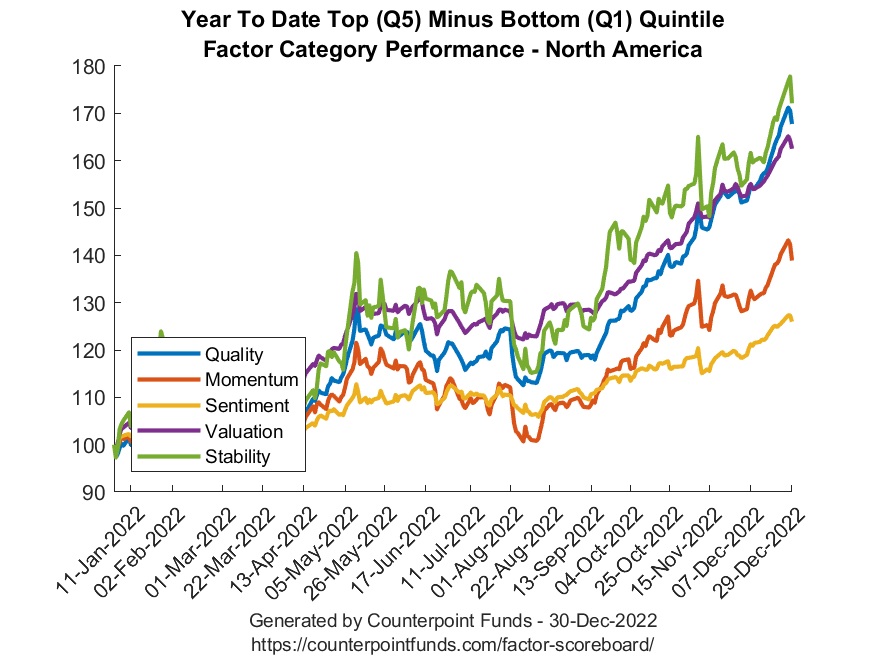
| Quintile 1 (Short) | Quintile 5 (Long) | Q5 – Q1 | |
|---|---|---|---|
| Quality | -50.12% | -11.67% | 38.45% |
| Momentum | -41.61% | -12.68% | 28.93% |
| Sentiment | -32.49% | -11.52% | 20.97% |
| Valuation | -43.17% | -4.40% | 38.77% |
| Stability | -48.20% | 1.94% | 50.14% |
As of 12-29-22 |
|||
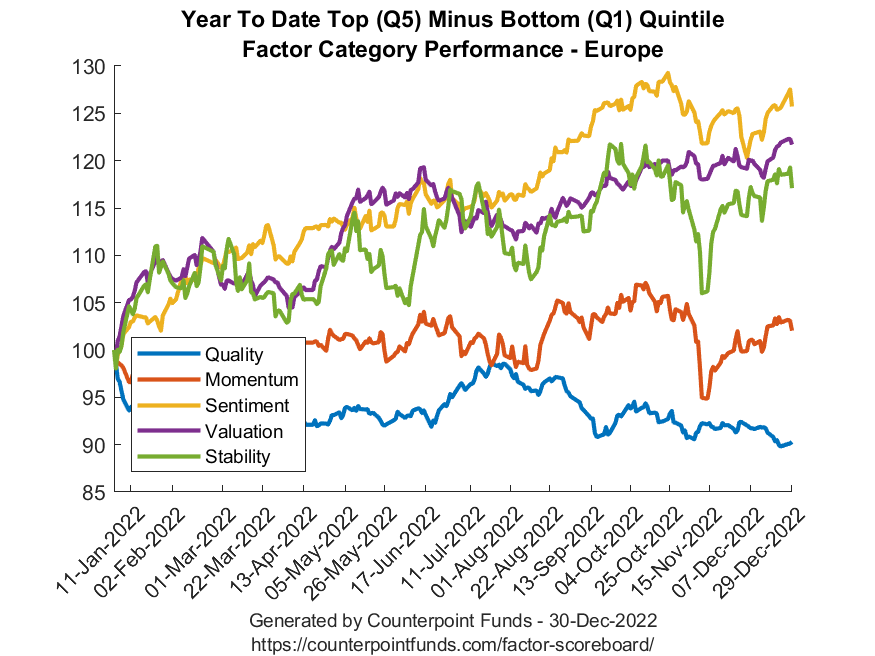
Europe Factor Category Returns
| Quintile 1 (Short) | Quintile 5 (Long) | Q5 – Q1 | |
|---|---|---|---|
| Quality | -9.01% | -17.07% | -8.07% |
| Momentum | -18.42% | -14.58% | 3.84% |
| Sentiment | -27.42% | -7.07% | 20.35% |
| Valuation | -22.09% | -4.02% | 18.07% |
| Stability | -24.16% | -6.83% | 17.33% |
As of 12-29-22 |
|||
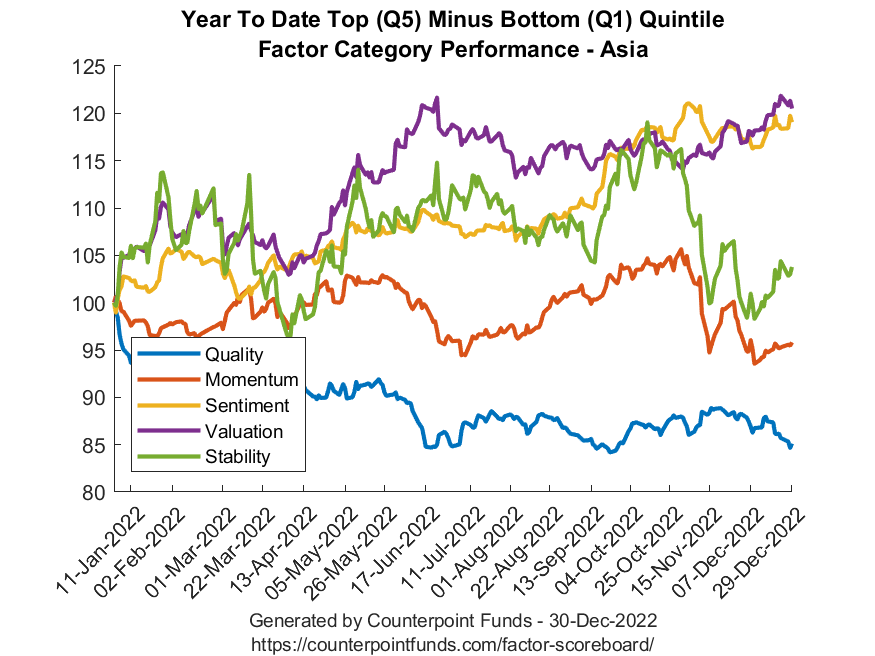
Asia Factor Category Returns
| Quintile 1 (Short) | Quintile 5 (Long) | Q5 – Q1 | |
|---|---|---|---|
| Quality | -2.25% | -17.05% | -14.80% |
| Momentum | -9.63% | -11.95% | -2.32% |
| Sentiment | -18.30% | -1.87% | 16.43% |
| Valuation | -17.21% | 1.73% | 18.94% |
| Stability | -8.94% | 0.02% | 8.96% |
As of 12-29-22 |
|||

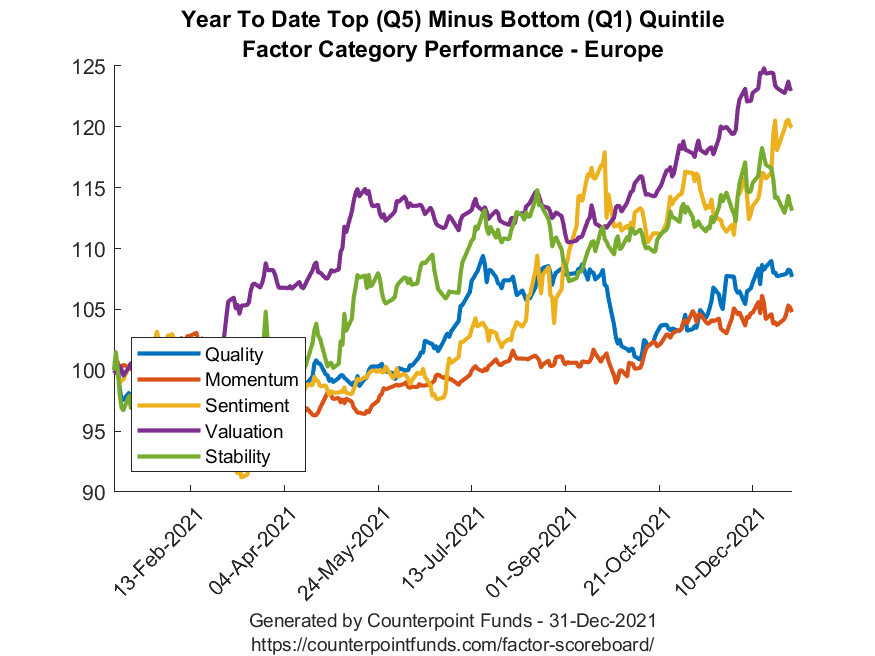
| Quintile 1 (Short) | Quintile 5 (Long) | Q5 – Q1 | |
|---|---|---|---|
| Quality | -12.13% | 18.77% | 30.90% |
| Momentum | 1.38% | 20.09% | 18.71% |
| Sentiment | 8.85% | 11.55% | 2.71% |
| Valuation | 1.83% | 40.25% | 38.41% |
| Stability | -7.58% | 19.85% | 27.43% |
As of 12-31-21 |
|||
| Quintile 1 (Short) | Quintile 5 (Long) | Q5 – Q1 | |
|---|---|---|---|
| Quality | 11.82% | 21.46% | 9.63% |
| Momentum | 14.43% | 19.74% | 5.31% |
| Sentiment | -0.88% | 21.13% | 22.00% |
| Valuation | 7.35% | 33.14% | 25.79% |
| Stability | 4.28% | 20.50% | 16.22% |
As of 12-31-21 |
|||
| Quintile 1 (Short) | Quintile 5 (Long) | Q5 – Q1 | |
|---|---|---|---|
| Quality | 13.91% | 5.66% | -8.25% |
| Momentum | 8.73% | 8.59% | -0.13% |
| Sentiment | 20.79% | 11.77% | -9.02% |
| Valuation | 4.87% | 20.72% | 15.85% |
| Stability | 11.85% | 10.84% | -1.01% |
As of 12-31-21 |
|||
| Quintile 1 (Short) | Quintile 5 (Long) | Q5 – Q1 | |
|---|---|---|---|
| Quality | 35.26% | 30.28% | -4.98% |
| Momentum | 38.16% | 37.93% | -0.22% |
| Sentiment | 42.85% | 21.96% | -20.90% |
| Valuation | 59.66% | 20.00% | -39.66% |
| Stability | 63.04% | 9.26% | -53.78% |
As of 12-31-20 |
|||
| Quintile 1 (Short) | Quintile 5 (Long) | Q5 – Q1 | |
|---|---|---|---|
| Quality | 5.19% | 14.26% | 9.07% |
| Momentum | 3.56% | 18.90% | 15.34% |
| Sentiment | 1.02% | 6.38% | 5.36% |
| Valuation | 23.55% | -2.31% | -25.86% |
| Stability | 17.08% | -0.18% | -17.26% |
As of 12-31-20 |
|||
| Quintile 1 (Short) | Quintile 5 (Long) | Q5 – Q1 | |
|---|---|---|---|
| Quality | 11.46% | 20.08% | 8.63% |
| Momentum | 16.52% | 17.55% | 1.03% |
| Sentiment | 0.72% | 12.21% | 11.50% |
| Valuation | 24.75% | 4.20% | -20.54% |
| Stability | 37.19% | -2.35% | -39.54% |
As of 12-31-20 |
|||
| Quintile 1 (Short) | Quintile 5 (Long) | Q5 – Q1 | |
|---|---|---|---|
| Quality | 27.03% | 23.23% | -3.80% |
| Momentum | 26.08% | 26.51% | 0.44% |
| Sentiment | 23.32% | 27.55% | 4.24% |
| Valuation | 29.61% | 24.22% | -5.39% |
| Stability | 27.15% | 24.29% | -2.86% |
As of 12-31-19 |
|||
| Quintile 1 (Short) | Quintile 5 (Long) | Q5 – Q1 | |
|---|---|---|---|
| Quality | 16.47% | 29.02% | 12.55% |
| Momentum | 22.99% | 29.67% | 6.68% |
| Sentiment | 27.71% | 29.62% | 1.91% |
| Valuation | 20.39% | 25.13% | 4.74% |
| Stability | 25.75% | 22.23% | -3.51% |
As of 12-31-19 |
|||
| Quintile 1 (Short) | Quintile 5 (Long) | Q5 – Q1 | |
|---|---|---|---|
| Quality | 3.78% | 26.12% | 22.34% |
| Momentum | 12.80% | 13.09% | 0.29% |
| Sentiment | 19.40% | 13.16% | -6.24% |
| Valuation | 9.18% | 14.46% | 5.29% |
| Stability | 9.23% | 11.39% | 2.16% |
As of 12-31-19 |
|||
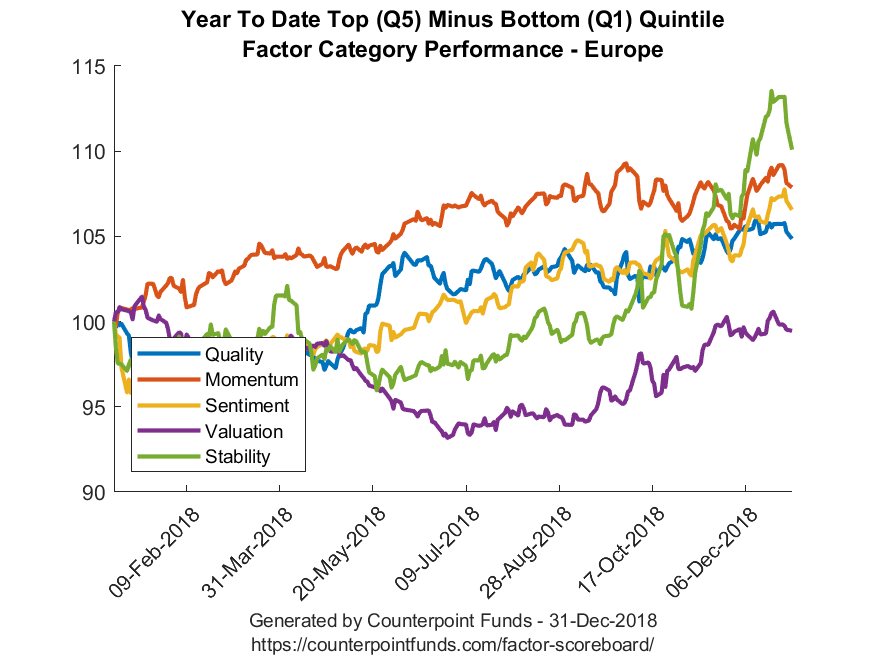

| Quintile 1 (Short) | Quintile 5 (Long) | Q5 – Q1 | |
|---|---|---|---|
| Quality | -14.16% | -5.32% | 8.84% |
| Momentum | -13.27% | -8.52% | 4.74% |
| Sentiment | -15.19% | -10.40% | 4.78% |
| Valuation | -12.14% | -14.46% | -2.32% |
| Stability | -12.67% | -5.82% | 6.85% |
As of 12-31-18 |
|||
| Quintile 1 (Short) | Quintile 5 (Long) | Q5 – Q1 | |
|---|---|---|---|
| Quality | -14.83% | -10.57% | 4.26% |
| Momentum | -15.88% | -9.17% | 6.72% |
| Sentiment | -16.16% | -10.07% | 6.09% |
| Valuation | -13.81% | -14.11% | -0.30% |
| Stability | -15.50% | -5.77% | 9.73% |
As of 12-31-18 |
|||
| Quintile 1 (Short) | Quintile 5 (Long) | Q5 – Q1 | |
|---|---|---|---|
| Quality | -17.27% | -13.14% | 4.13% |
| Momentum | -15.42% | -17.32% | -1.90% |
| Sentiment | -18.56% | -13.24% | 5.32% |
| Valuation | -16.35% | -15.97% | 0.38% |
| Stability | -15.97% | -7.75% | 8.21% |
As of 12-31-18 |
|||
This is an informational resource only. The above factor category returns do not represent returns of holdings of Counterpoint’s Tactical Equity Fund. We compute factor categories by blending returns of individual factors in an equal-weighted manner. Counterpoint uses these individual factors as early-stage inputs to its equity funds’ market-neutral models. These returns are meant to give investors an indication of what is happening to broad factor return categories for various time frames. While these are not returns to Counterpoint’s funds, there may be a correlation between performance on the Factor Scoreboard and the funds’ market-neutral component.
Rankings based on financial statement quality characteristics, i.e. the Profitability anomaly.
Rankings based on historical market returns that have predictive characteristics.
Rankings reflect indicators of outlook such as revisions to analyst estimates of future earnings, share issuance changes, or measures of short interest and demand in the share lending market.
Rankings based on measures of company valuation such as price/sales ratio, and prices/earnings ratio.
Rankings based on measures of underlying company risk, such as volatility or beta.
The rankings used to group periodic returns are re-calculated daily based on live market and financial data, and factor category returns are based on live changes in ranking. Year-to-date factor returns are formulated using compounded daily factor returns given daily changing rankings within the period, while trailing 5-day and month-to-date factor returns are formulated using only the latest day’s ranking. This will explain differences between month-to-date and year-to-date returns when date periods overlap.
The above factor returns are grouped by quintiles. The 1st quintile (Q1) represents the average daily return of the lowest 20% ranking companies (potential shorts) for the category. The 5th quintile (Q5) represents the average periodic return for the top 20% ranking companies (potential longs) within the same category. Q5-Q1 is the periodic return to a theoretical portfolio that is long all of the top ranked companies and short the lowest ranked companies within the category. This represents an attempt to capture the spread in performance between “good” and “bad” companies. These return calculations assume no transaction costs or market frictions. These returns do not represent the returns of the Funds’ models. They represent raw factor category returns, and are unoptimized long-short returns determined with no consideration of market beta or industry exposure.
These funds invest in stocks chosen by a set of machine-learning models that use the factors within these broad category rankings as an input component, but may invest outside of the top and bottom quintiles for any individual factor or factor category as it balances the interactions between many factors simultaneously. Counterpoint collects market, fundamentals, and other financial data from S&P Global Market Intelligence to analyze a tradable universe of global stocks. For each stock, Counterpoint ranks individual factor exposures based on academic research. Counterpoint then takes the average return for the evaluation period within each ranking quintile, and then further averages that return across multiple factors within a category to produce a factor category return as displayed above. The individual factors within the above factor categories are actual factors that Counterpoint’s model considers in its aggregate scoring process.
There is no guarantee that any investment strategy will achieve its objectives, generate profits or avoid losses.

Year-ahead commentary is challenging for us: We don’t have a crystal ball, and we believe predictions contribute more to investment mistakes than outperformance. But the

One of the most common questions we hear from advisors and their clients is: How does A.I. actually work in quantitative investing? While the jargon

Since the market bottomed on April 8, 2025, investors have witnessed a highly speculative, “pro-junk” environment. Stocks with weak fundamentals—richly valued, unprofitable companies often fueled

Year-ahead commentary is challenging for us: We don’t have a crystal ball, and we believe predictions contribute more to investment mistakes than outperformance. But the

One of the most common questions we hear from advisors and their clients is: How does A.I. actually work in quantitative investing? While the jargon

Since the market bottomed on April 8, 2025, investors have witnessed a highly speculative, “pro-junk” environment. Stocks with weak fundamentals—richly valued, unprofitable companies often fueled
Mutual Funds involve risk including the possible loss of principal. Investors should carefully consider the investment objectives, risks, charges and expenses of the funds managed by Counterpoint Funds. This and other important information about the funds is available in their prospectuses, which can be obtained at counterpointfunds.com or by calling 844-273-8637. The prospectuses should be read carefully before investing. The Counterpoint Funds fund family is distributed by Northern Lights Distributors, LLC member FINRA/SIPC. To reach the Counterpoint sales team, please refer to our contact page.
Copyright © 2022, S&P Global Market Intelligence (and its affiliates, as applicable). Reproduction of any information, data or material, including ratings (“Content”) in any form is prohibited except with the prior written permission of the relevant party. Such party, its affiliates and suppliers (“Content Providers”) do not guarantee the accuracy, adequacy, completeness, timeliness or availability of any Content and are not responsible for any errors or omissions (negligent or otherwise), regardless of the cause, or for the results obtained from the use of such Content. In no event shall Content Providers be liable for any damages, costs, expenses, legal fees, or losses (including lost income or lost profit and opportunity costs) in connection with any use of the Content. A reference to a particular investment or security, a rating or any observation concerning an investment that is part of the Content is not a recommendation to buy, sell or hold such investment or security, does not address the suitability of an investment or security and should not be relied on as investment advice. Credit ratings are statements of opinions and are not statements of fact.
5516-NLD-09/01/2021
We’ve received your request for the featured event collateral. A Counterpoint Funds team member will be in touch shortly.
Subscribe to stay up to date on and receive our monthly perspective.
We’ve received your meeting request and a Counterpoint Funds team member will be in touch shortly.
Subscribe to stay up to date on and receive our monthly perspective.
We’ve received your event registration request and will be in touch shortly.
Subscribe to stay up to date on Counterpoint Funds and receive our monthly perspective.
We have received your application and look forward to reviewing your qualifications for the role. If your application seems like a good fit, we will contact you to discuss next steps.
Thank you again for your application and interest in joining the Counterpoint team!
We’ve received your message. A Counterpoint Funds team member will contact you soon.
Subscribe to stay up to date and receive our monthly perspective.