Important Risk Information
Mutual Funds involve risk including the possible loss of principal. The use of leverage by the Fund or an Underlying Fund, such as borrowing money to purchase securities or the use of derivatives, will indirectly cause the Fund to incur additional expenses and magnify the Fund’s gains or losses. Derivative instruments involve risks different from, or possibly greater than, the risks associated with investing directly in securities and other traditional investments. There is a risk that issuers and counterparties will not make payments on securities and other investments held by the Fund, resulting in losses to the Fund. Past performance is no guarantee of future results. There is no assurance the Fund will meet their stated objectives.
Investments cannot be made in an index. Unmanaged index returns do not reflect any fees, expenses, or sales charges. Past performance is no guarantee of future results. There is no guarantee that any investment will achieve its objectives, generate positive returns, or avoid losses. The Adviser’s reliance on its strategy and judgments about the attractiveness, value and potential appreciation of particular securities and the tactical allocation among investments may prove to be incorrect and may not produce the desired results. No level of diversification can ensure profits or guarantee against loss.
The Counterpoint Tactical Equity Fund’s (CPAEX) maximum sales charge for Class A shares is 5.75%. The Fund’s adviser has contractually agreed to waive its fees and reimburse expenses of the Fund, at least until February 1, 2025 to ensure that Total Annual Fund Operating Expenses After Fee Waiver and Reimbursement but does not include: (i) any front-end or contingent deferred loads; (ii) brokerage fees and commissions, (iii) acquired fund fees and expenses; (iii) borrowing costs (such as interest and dividend expense on securities sold short); (iv) taxes; and (v) extraordinary expenses, such as litigation expenses (which may include indemnification of Fund officers and Trustees, contractual indemnification of Fund service providers (other than the Adviser)) do not exceed 2.00%, 2.75% and 1.75% of average daily net assets attributable to Class A, Class C, and Class I shares, respectively.
The Total Annual Fund Operating Expenses for the Fund (CPIEX) are 2.06%, 2.81% and 1.81% for Class A, C and I shares, respectively. The Counterpoint Tactical Income Fund’s A shares (CPATX) have a Front-End Sales Charge commission or “load” of 4.50%, with lower rates for accounts over $25,000, and 12b-1 distribution fee of 0.25% per year. The total annual fund operation expense ratio, gross of any fee waivers or expense reimbursements, are 2.28%, 3.03% and 2.03%, for Class A, Class C, and Class I shares respectively.
The Counterpoint Tactical Municipal Fund’s A shares (TMNAX) have a Front-End Sales Charge (commission or “load”) of 4.50%, with lower rates for accounts over $25,000. The total annual fund operating expense ratio, gross of any fee waivers or expense reimbursements, is 1.89%, 2.64%, and 1.64%, for Class A, Class C, and Class I shares respectively. Please review the fund’s prospectus for more information regarding the fund’s fees and expenses. For performance information current to the most recent month-end, please call toll-free 844-273-8637.
Disclosures
The forecast and/or opinions may not come to pass and are subject to change. The article contains links to other sites that are not maintained by Counterpoint. We do not review or monitor those websites and we are not responsible for the content of any such linked websites. If you decide to access such linked websites, you do so at your sole risk. Neither Counterpoint nor any of its affiliates are responsible for the information, materials, products or services obtained on or from such other websites, nor will any of them be liable in any respect whatsoever for any damages arising from your access to such websites. Any links to such websites are provided merely for the convenience of our readers and the inclusion of these links does not imply an endorsement, representation or warranty by Counterpoint or any of its affiliates with respect to any such linked websites or the content, products or services contained or accessible through, or the operators of, such websites.
Index Definitions
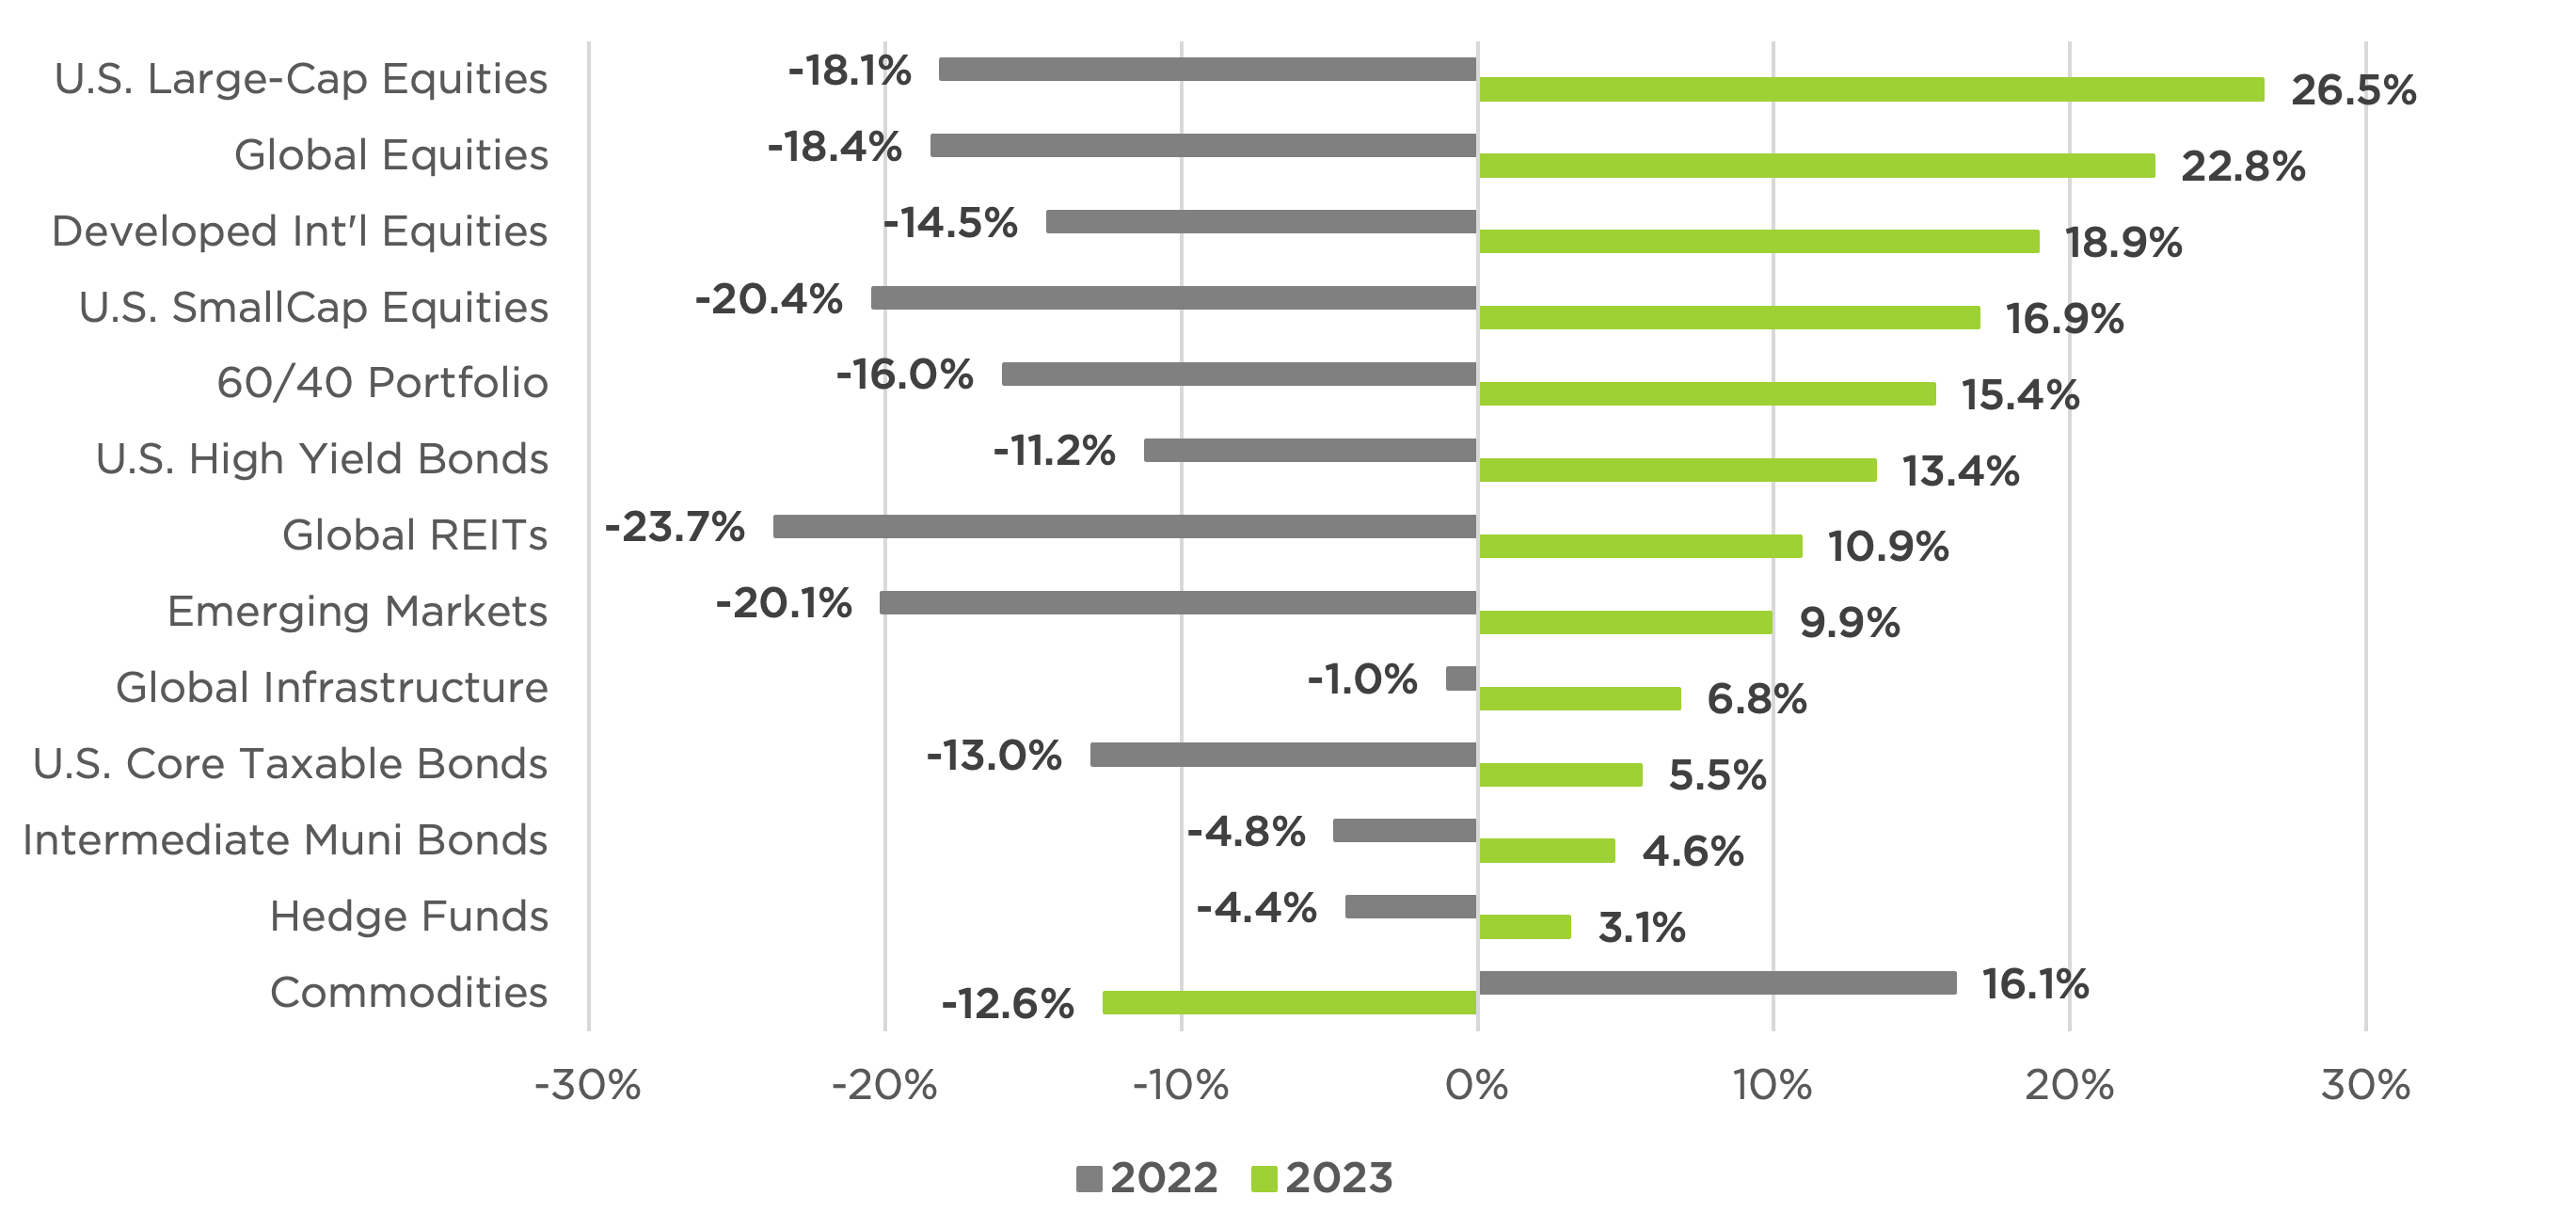
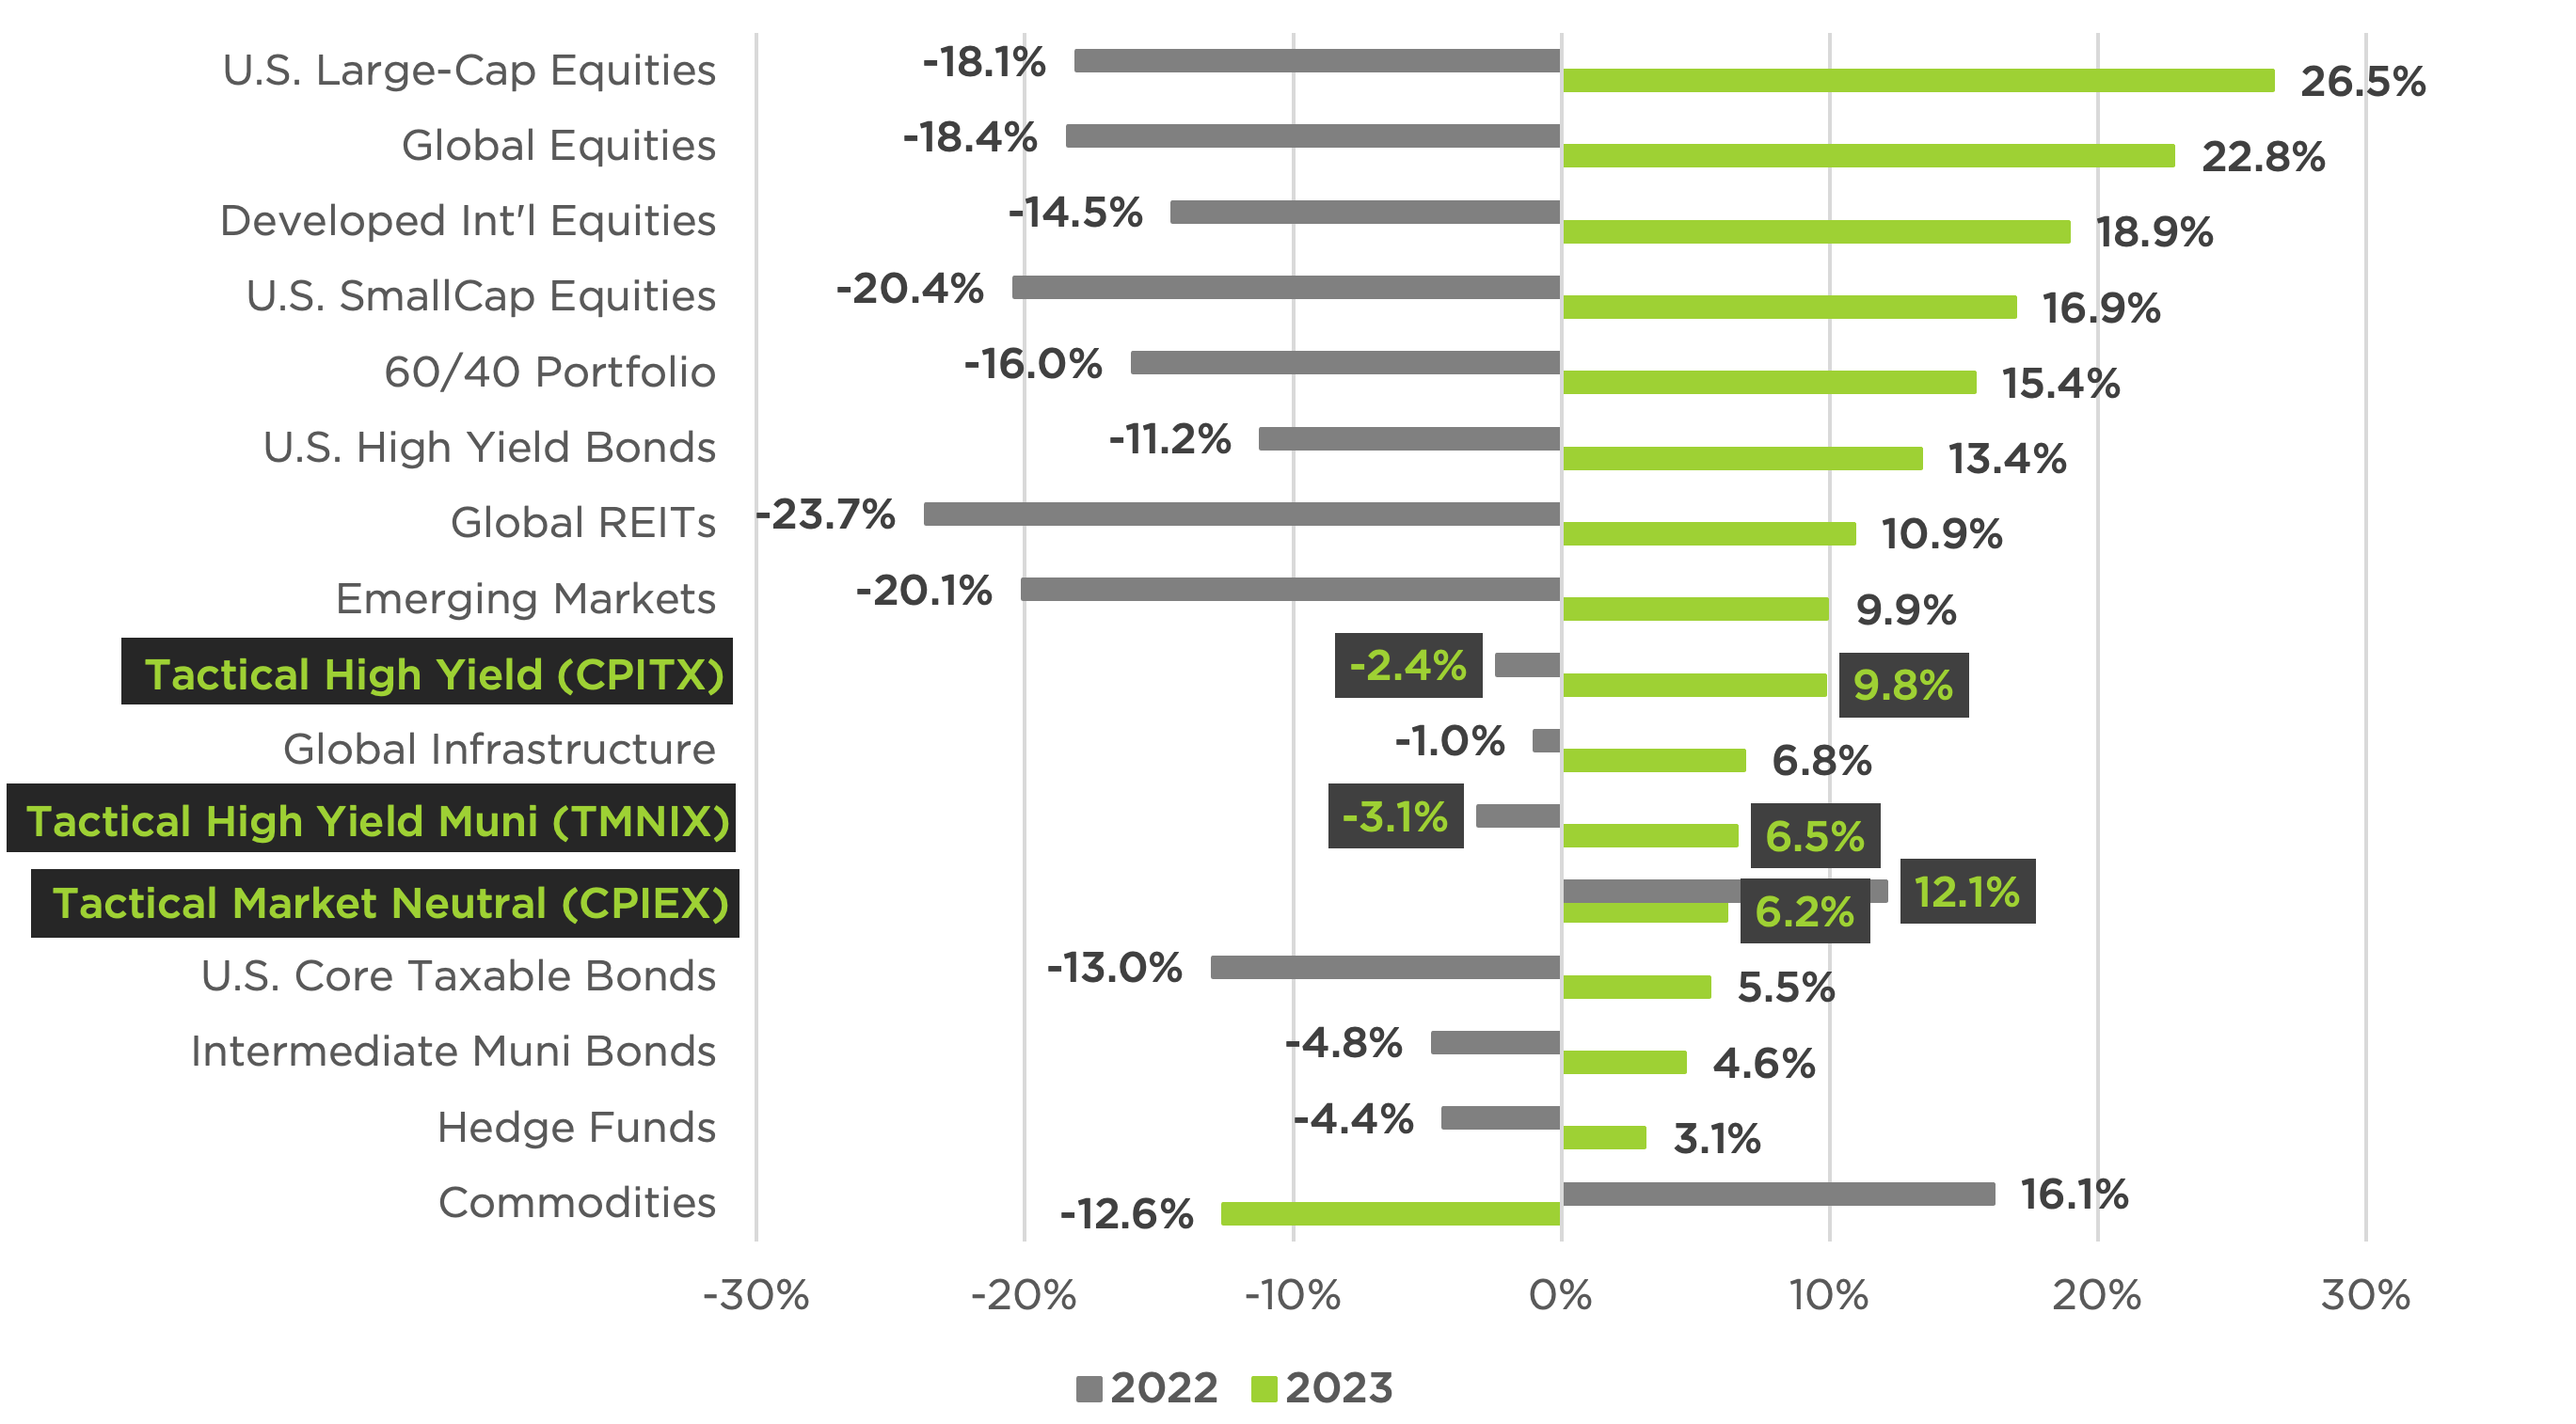
US Large Cap is composed of the S&P 500 Index, or Standard & Poor’s 500 Index, is a market-capitalization-weighted index of 500 leading publicly traded companies in the U.S.
Global Equities is completely composed of the MSCI World Index that tracks the performance of around 1500 large and mid-cap companies across 23 developed countries.
Developed Intl Equities is completely composed of the MSCI EAFE Index, which is designed to represent the performance of large and mid-cap securities across 21 developed markets.
US Small Cap is completely composed of the Russell 2000 Index, which measures the performance of the 2,000 smaller companies included in the Russell 3000 Index.
60/40 Portfolio is 60% composed of the S&P 500 Index and 40% the Bloomberg Barclays US Aggregate Bond Index.
US High Yield is completely composed of the Bloomberg Barclays US Corporate High Yield Bond Index measures the USD-denominated, high-yield, fixed-rate corporate bond market.
Global REITs is completely composed of the FTSE EPRA/NAREIT Global REIT Index, which is a market capitalization-weighted index that tracks the performance of real estate equities globally. It’s designed to represent the general trends of listed real estate equities in both developed and emerging markets.
Emerging Markets is completely composed of the MSCI Emerging Markets Index, which is a benchmark index that measures the stock market performance of emerging countries. It’s made up of mid- and large-cap stocks from 24 emerging market countries. The index is designed to adapt to the dynamic nature of emerging markets and is rebalanced twice a year.
Global Infrastructure is completely composed of the S&P Global Infrastructure Index, which is designed to track 75 companies from around the world chosen to represent the listed infrastructure industry while maintaining liquidity and tradability. To create diversified exposure, the index includes three distinct infrastructure clusters: energy, transportation, and utilities.
US Taxable Bonds is completely composed of the Bloomberg Barclays US Aggregate Bond Index is made up of the Barclays US Government/Corporate Bond Index, Mortgage- Backed Securities Index, and Asset-Backed Securities Index, including securities that are of investment grade quality or better, have at least one year to maturity, and have an outstanding par value of at least $100 million. As it is not possible to invest in the index the data shown does not reflect or compare features of an actual investment, such as its objectives, costs and expenses, liquidity, safety, guarantees or insurance, fluctuation of principal or return, or tax features. Indexes do not include management fees.
Intermediate Muni is completely composed of the Bloomberg Municipal Bond Index, which is a market-value-weighted index that tracks the performance of the long-term US tax-exempt bond market. It’s made up of four main sectors: state and local general obligation bonds, revenue bonds, insured bonds, and prerefunded bonds.
Hedge Fund is completely composed of the Goldman Sachs Hedge Fund VIP Index, which is an index that aims to expose investors to equity securities that are expected to affect the long-term portfolios of hedge funds.
Commodities is completely composed of the S&P GSCI Index, a benchmark that is broad-based and production weighted to represent the global commodity market beta. The index is designed to be investable by including the most liquid commodity futures, and provides diversification with low correlations to other asset classes.
The Bloomberg Barclays Capital High Yield Municipal Bond Index is an unmanaged index made up of bonds that are non-investment grade, or unrated by Moody’s Investors Service with a remaining maturity of at least 1 year.
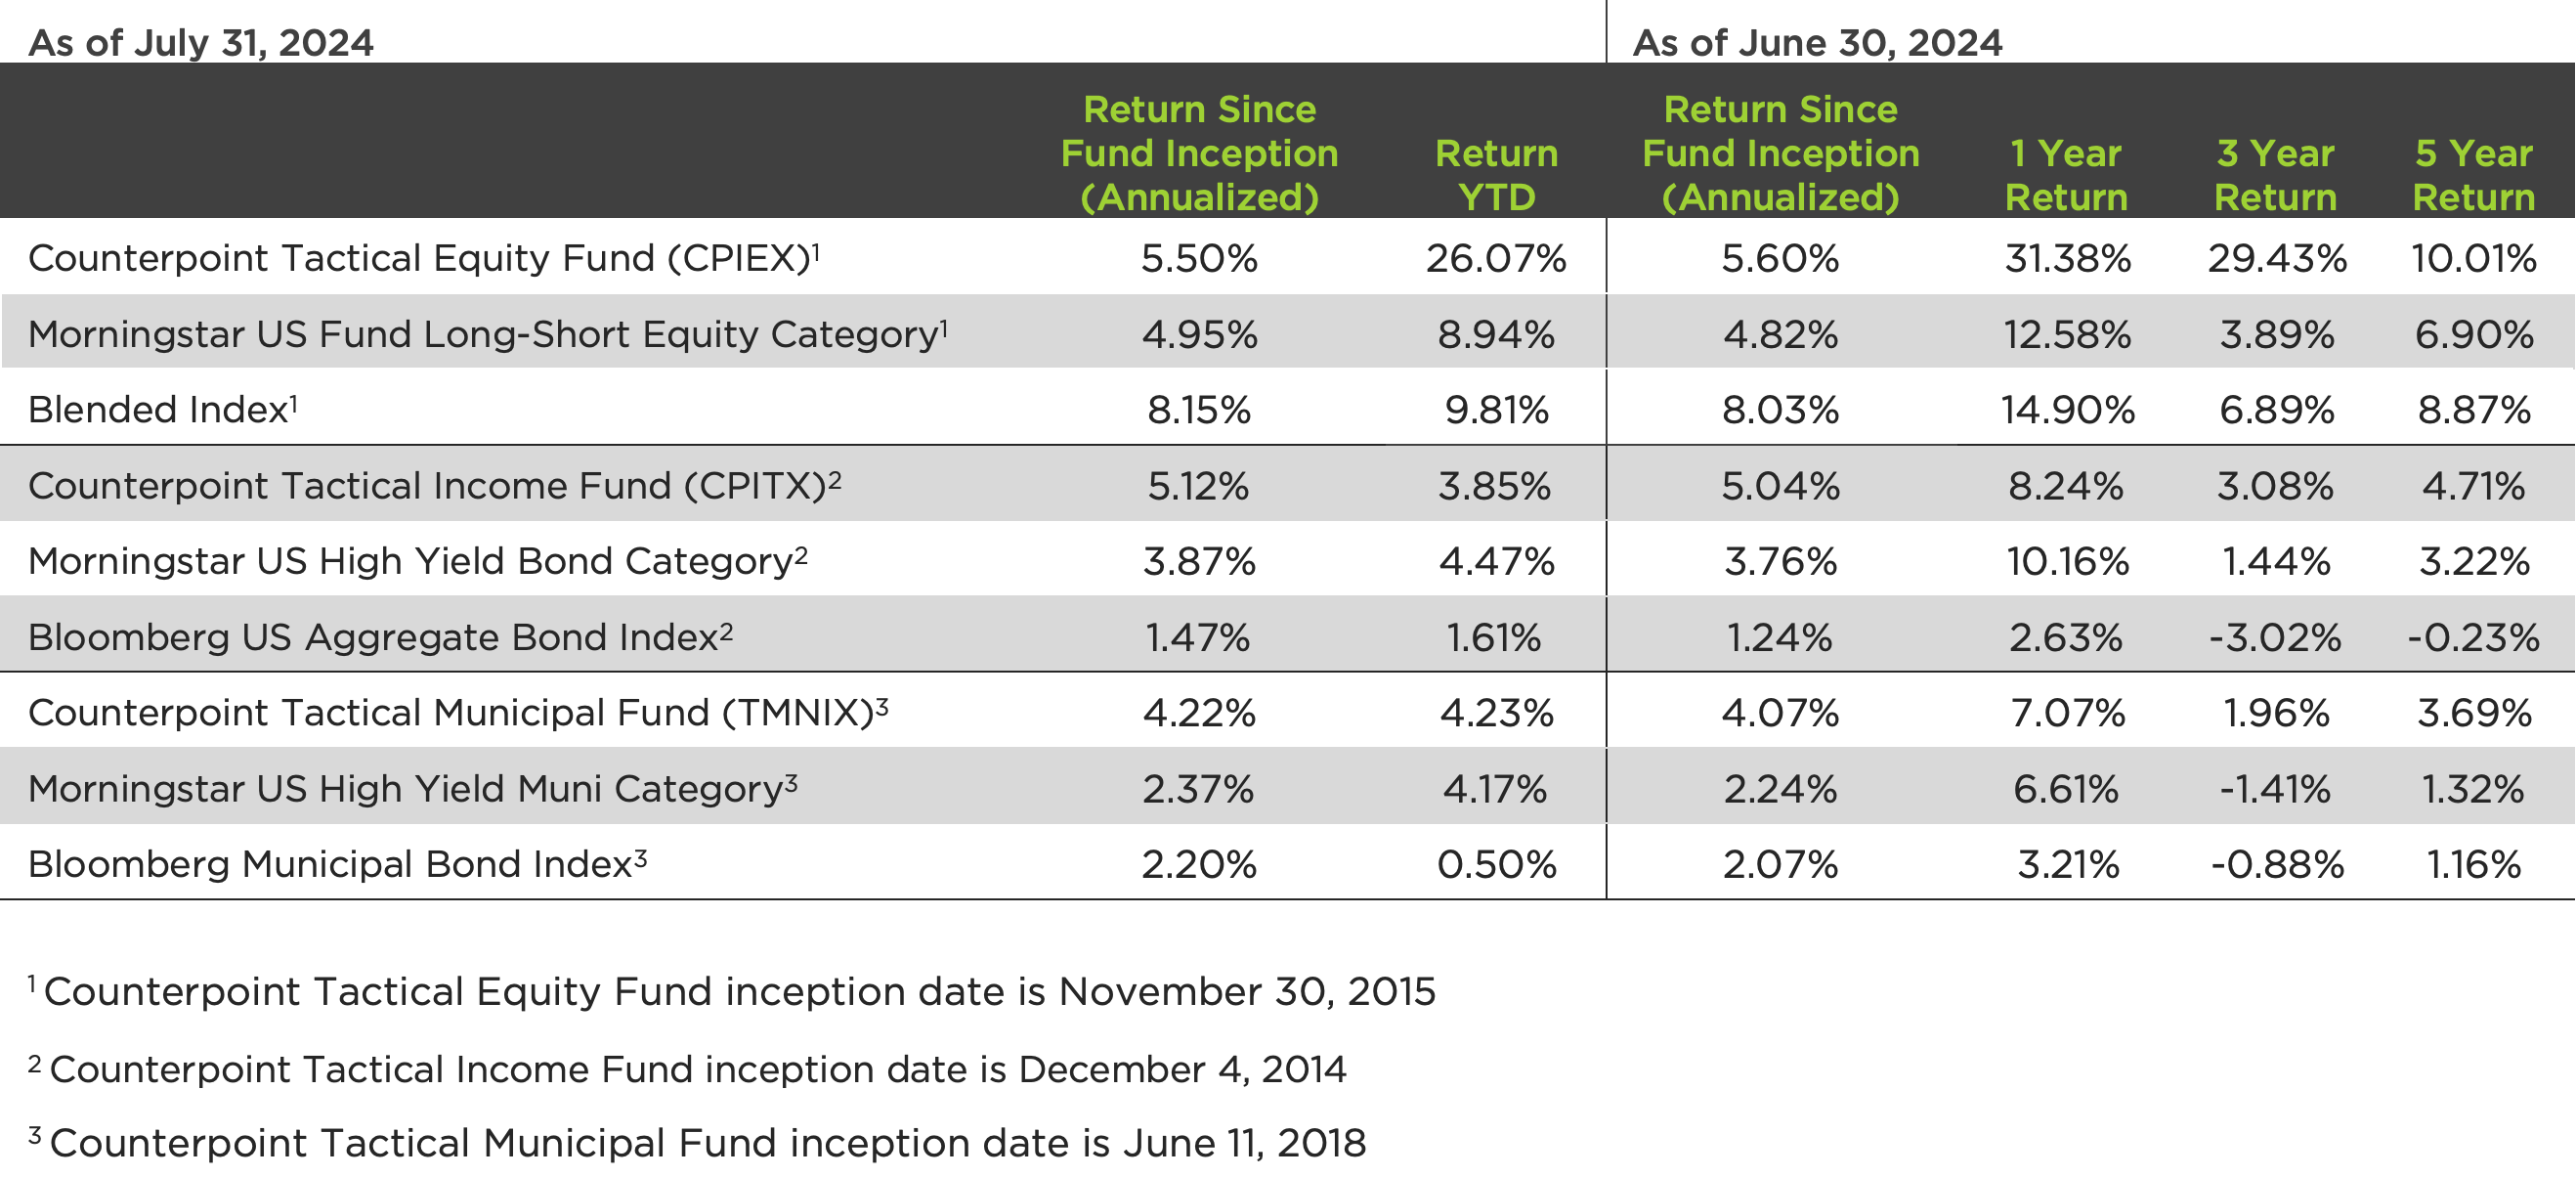
The Morningstar US Fund High Yield Bond Category is made up of U.S. high-income debt securities where at least 65% or more of bond assets are not rated or are rated by a major agency such as Standard & Poor’s or Moody’s at the level of BB (considered speculative for taxable bonds) and below. The Morningstar US Fund High Yield Bond category is made up of U.S. high-income debt securities where at least 65% or more of bond assets are not rated or are rated by a major agency such as Standard & Poor’s or Moody’s at the level of BB (considered speculative for taxable bonds) and below.
The Morningstar US High Yield Muni Category is made up of portfolios that typically invest a substantial portion of assets in high-income municipal securities that are not rated or that are rated at the level of or below BBB (considered high-yield within the municipal-bond industry) by a major ratings agency such as Standard & Poor’s or Moody’s.
CPIEX’s Blended Index is a composite of 50% of the S&P 500 Total Return Index and 50% of the Bloomberg 1-3 Month U.S. Treasury Bill Index. Index returns assume reinvestment of dividends. Investors may not invest in the Index directly. Unlike the Fund’s returns, the Index does not reflect any fees or expenses.
The Morningstar US Long-Short Equity Category is made up of portfolios that take a net long stock position, meaning the total market risk from the long positions is not completely offset by the market risk of the short positions. Long-short equity funds’ total return, therefore, is a combination of the return from market exposure (beta) plus any value-added from stock-picking or market-timing (alpha).
Definitions
Return is the percentage change in the value of an investment, and/or cash flows which the investor receives from that investment, such as interest payments, coupons, cash dividends, stock dividends or the payoff from a derivative or structured product, over a specified time period.
© 2024 Morningstar. All Rights Reserved. The information contained herein: (1) is proprietary to Morningstar and/or its content providers; (2) may not be copied or distributed; and (3) is not warranted to be accurate, complete or timely. Neither Morningstar nor its content providers are responsible for any damages or losses arising from any use of this information. Past performance is no guarantee of future results.
Important information about the funds are available in their prospectus, which can be obtained at counterpointfunds.com or by calling 844-273-8637. The prospectus should be read carefully before investing. Investors should carefully consider the investment objectives, risks, charges, and expenses of the funds managed by Counterpoint Funds. The Counterpoint Funds fund family is distributed by Northern Lights Distributors, LLC member FINRA/SIPC. Counterpoint Funds, LLC is not affiliated with Northern Lights Distributors, LLC member FINRA/SIPC.
20240809-3747072