How to Wring Out Opportunities in a Volatile, Low-Return Market


Many investors are licking their wounds after 2022, a once-in-a-generation negative year for both fixed income and equities. A quarter into 2023, it’s hard to say we’ve escaped the doldrums. Bank failures, a sharply inverted yield curve, and a murky inflationary picture may leave some investors coming up short in the search for attractive opportunities – let alone opportunities that can diversify stock and bond holdings.

Despite these challenges, as we continue into 2023 we are confident in one group of recently overlooked investment strategies with a lot of long-term validation and limited exposure to stock and bond market risk: Long-short factor equity strategies.

Based on academic research, these strategies seek opportunities that arise when investors make common, recurring mistakes driven by emotion or psychological biases. Investors may be familiar with a few of these:

      • Profitability: Shares of more profitable companies tend to outperform shares of less- or profitable companies over time. (Investors tend not to properly value current profitability and overestimate the future profits of currently low- or unprofitable firms.)

      • Volatility: Less-volatile stocks tend to outperform more-volatile stocks over time. (Investors tend to look for winning lottery tickets by investing in very volatile companies and overlooking steadier performers.)

    Using these well documented investor mistakes, an investor can create long-short portfolios with a) low- to no sensitivity to the stock or bond markets; b) an objective to profit from these common investing mistakes.

    These strategies earn the greatest profits when there’s a wide gap between the stocks they buy and the stocks they sell short – and then that gap closes. A wide gap in valuation between cheap and expensive stocks may signal a more favorable opportunity for a value strategy, for example; when that gap is narrow, an investor may not expect the strategy to deliver the same amount of return.

    To help investors see where the opportunities might be in long-short factor strategies, we created tools designed to measure the gap, or “factor spread” between the stocks a long-short factor investor might buy or sell short. These tools are available on our Live Factor Spreads page, and they’re updated daily.

    Factor Strategy Refresher
    • Value: Buy the cheapest stocks, and sell short the most expensive stocks.

    • Profitability: Buy the most profitable companies, and sell short the least and unprofitable companies.

    • Volatility: Buy the least volatile stocks, and sell short the most volatile stocks.

    These tools have been indicating meaningful opportunities in value, profitability, and volatility oriented long-short strategies for the past couple years. Let’s take a look.

    Valuation (Long-Short) Factor Spread – March 20, 2023


    Source: Counterpoint Funds Research. A normalized score (Z-score) above zero (representing a 50th percentile) in the long-short valuation spread indicates top quintile, or top 20% of a population, long-short value across several value factors is cheap relative to history. Put another way, it says the opposite of value (not exactly growth, but close enough for discussion), is expensive relative to history.

    According to our valuation measurements, the gap between the most expensive and least expensive stocks in the global stock market (the “Valuation Factor Spread”) has been wider than it is today 9% of the time since 1981. If that gap closes toward the historical average, that would mean substantial profits for long-short value strategies.

    Profitability (Long-Short) Factor Spread – March 20, 2023


    Source: Counterpoint Funds Research. A normalized score (Z-score) above zero (representing a 50th percentile)  indicates the “profitability gap” between highly profitable stocks and unprofitable stocks is wider than historical averages, and extra potential risk premium can be earned from the reversion of that gap to normal levels. 

    The gap between the most- and least-profitable companies (the “Profitability Factor Spread”) is wider than the historical average – not to the same extent as value, but still wider than it’s been roughly 2/3 of the time since 1981.

    It hasn’t all been smooth sailing. Difficulties across the board for traditional asset classes was the big investment headline of 2022. Amid the challenges, value stocks have shown relative resilience, and market neutral equity.

    Volatility (Long-Short) Factor Spread


    Source: Counterpoint Funds Research. A normalized score (Z-score) above zero (representing a 50th percentile) indicates the “volatility gap” between highly volatile stocks and low volatility stocks is wider than historical averages. Implicitly, there is more collective disagreement and potential inefficiency surrounding the value of high volatility stocks versus low volatility stocks relative to history.

    The gap between the least- and most-volatile stocks (the “Volatility Factor Spread”) is also pretty wide relative to its history – it’s only been wider less than 20% of the time since 1981. Rather than pick any single factor strategy, an investor can diversify across valuation, profitability, volatility, and other factors to avoid having their eggs all in a single factor-oriented basket. These strategies, called “multifactor” long-short strategies, are designed to provide investors with exposure to a variety of strategies that can diversify a stock-and-bond portfolio.

    In 2022, the Counterpoint Tactical Equity Fund (CPIEX) illustrated the potential benefit of a long-short multifactor strategy, returning 12.12% in a down year for both stocks and bonds.

    Watch the on-demand recording of our recent live-webinar event:

    The Counterpoint Fall 2023 Equity Update

    Tuesday, November 10th

    Conclusion

    As investors contemplate a challenging macroeconomic environment and look for ways to diversify their stock and fixed income investments, they may want to take a closer look at long-short factor strategies. In addition to targeting strong diversification potential vs. traditional asset classes, we think there’s reason to believe that certain long-short equity strategies may be well positioned relative to their history.

    Return of $100 – 01/01/2022 to 03/21/2023


    Source: Morningstar.


    Counterpoint Tactical Equity Fund inception date is November 30, 2015


    The performance data displayed here represents past performance, which is no guarantee of future results. Current performance may be lower or higher than the performance data quoted. The investment return and principal value of an investment will fluctuate so that investor’s shares, when redeemed, may be worth more or less than their original cost. The total annual fund operating expenses are 2.03%, 2.78% and 1.78% for Class A, C and I shares respectively. The Fund’s maximum sales charge for Class A shares is 5.75%. The Fund’s adviser has contractually agreed to waive its fees and reimburse expenses of the Fund, at least until February 1, 2024 to ensure that Total Annual Fund Operating Expenses After Fee Waiver and Reimbursement (excluding (i) any front-end or contingent deferred loads; (ii) brokerage fees and commissions; (iii) acquired fund fees and expenses; (iii) borrowing costs (such as interest and dividend expense on securities sold short); (iv) taxes; and (v) extraordinary expenses, such as litigation expenses (which may include indemnification of Fund officers and Trustees, contractual indemnification of Fund service providers (other than the Fund’s adviser))) do not exceed 2.00%, 2.75% and 1.75% of average daily net assets attributable to Class A, Class C, and Class I shares, respectively. Without the fee waiver, total annual fund operating expenses would be, 2.13%, 2.88% and 1.88% for Class A, C and I shares, respectively. For performance information current to the most recent month-end, please call toll-free 844-273-8637.

    There is no guarantee that any investment strategy will achieve its objectives, generate profits or avoid losses. Important information about the funds are available in their prospectuses, which can be obtained at counterpointfunds.com or by calling 844-273-8637. The prospectuses should be read carefully before investing. Investors should carefully consider the investment objectives, risks, charges, and expenses of the funds managed by Counterpoint Funds. The Counterpoint Funds fund family is distributed by Northern Lights Distributors, LLC member FINRA/SIPC. Counterpoint Funds, LLC is not affiliated with Northern Lights Distributors, LLC member FINRA/SIPC.


    Important Risk Information

    Investments cannot be made in an index. Unmanaged index returns do not reflect any fees, expenses or sales charges. Past performance is no guarantee of future results. There is no guarantee that any investment will achieve its objectives, generate positive returns, or avoid losses. The Adviser’s reliance on its strategy and judgments about the attractiveness, value and potential appreciation of particular securities and the tactical allocation among investments may prove to be incorrect and may not produce the desired results. No level of diversification can ensure profits or guarantee against loss.

    Mutual Funds involve risk including the possible loss of principal. The fund (and long-short strategies) hold long positions, which entail purchasing securities with the intention of holding them in anticipation of a price increase, and short positions, which entail borrowing securities with the intention of holding them in anticipation of a price decrease. The use of leverage by the Fund or an Underlying Fund, such as borrowing money to purchase securities or the use of derivatives, will indirectly cause the Fund to incur additional expenses and magnify the Fund’s gains or losses. A higher portfolio turnover will result in higher transactional and brokerage costs. Derivative instruments involve risks different from, or possibly greater than, the risks associated with investing directly in securities and other traditional investments.

    Overall equity and fixed income market risk, including volatility, may affect the value of individual instruments in which the Fund invests. The net asset value of the Fund will fluctuate based on changes in the value of the U.S. and/or foreign equity securities held by the Fund. Fixed income risk factors include credit risk and prepayment risk. When the Fund invests in other investment companies, it will bear additional expenses based on its pro rata share of the other investment company’s operating expenses, including the potential duplication of management fees.

    The Fund may invest in options which hold an underlying risk greater than securities. The Fund’s losses are potentially large in a written put transaction and potentially unlimited in an unhedged written call transaction. The earnings and prospects of small and medium sized companies are more volatile than larger companies and may experience higher failure rates than larger companies. The Fund may use swaps to enhance returns and manage risk, which involves risks possibly greater than, the risks associated with investing directly in securities and other traditional investments.

    The Adviser’s reliance on its strategy and its judgments about the value and potential appreciation securities in which the Fund invests may prove to be incorrect, including the Adviser’s tactical allocation of the Fund’s portfolio among its investments. The adviser’s investment model carries a risk that the mathematical model used might be based on one or more incorrect assumptions.

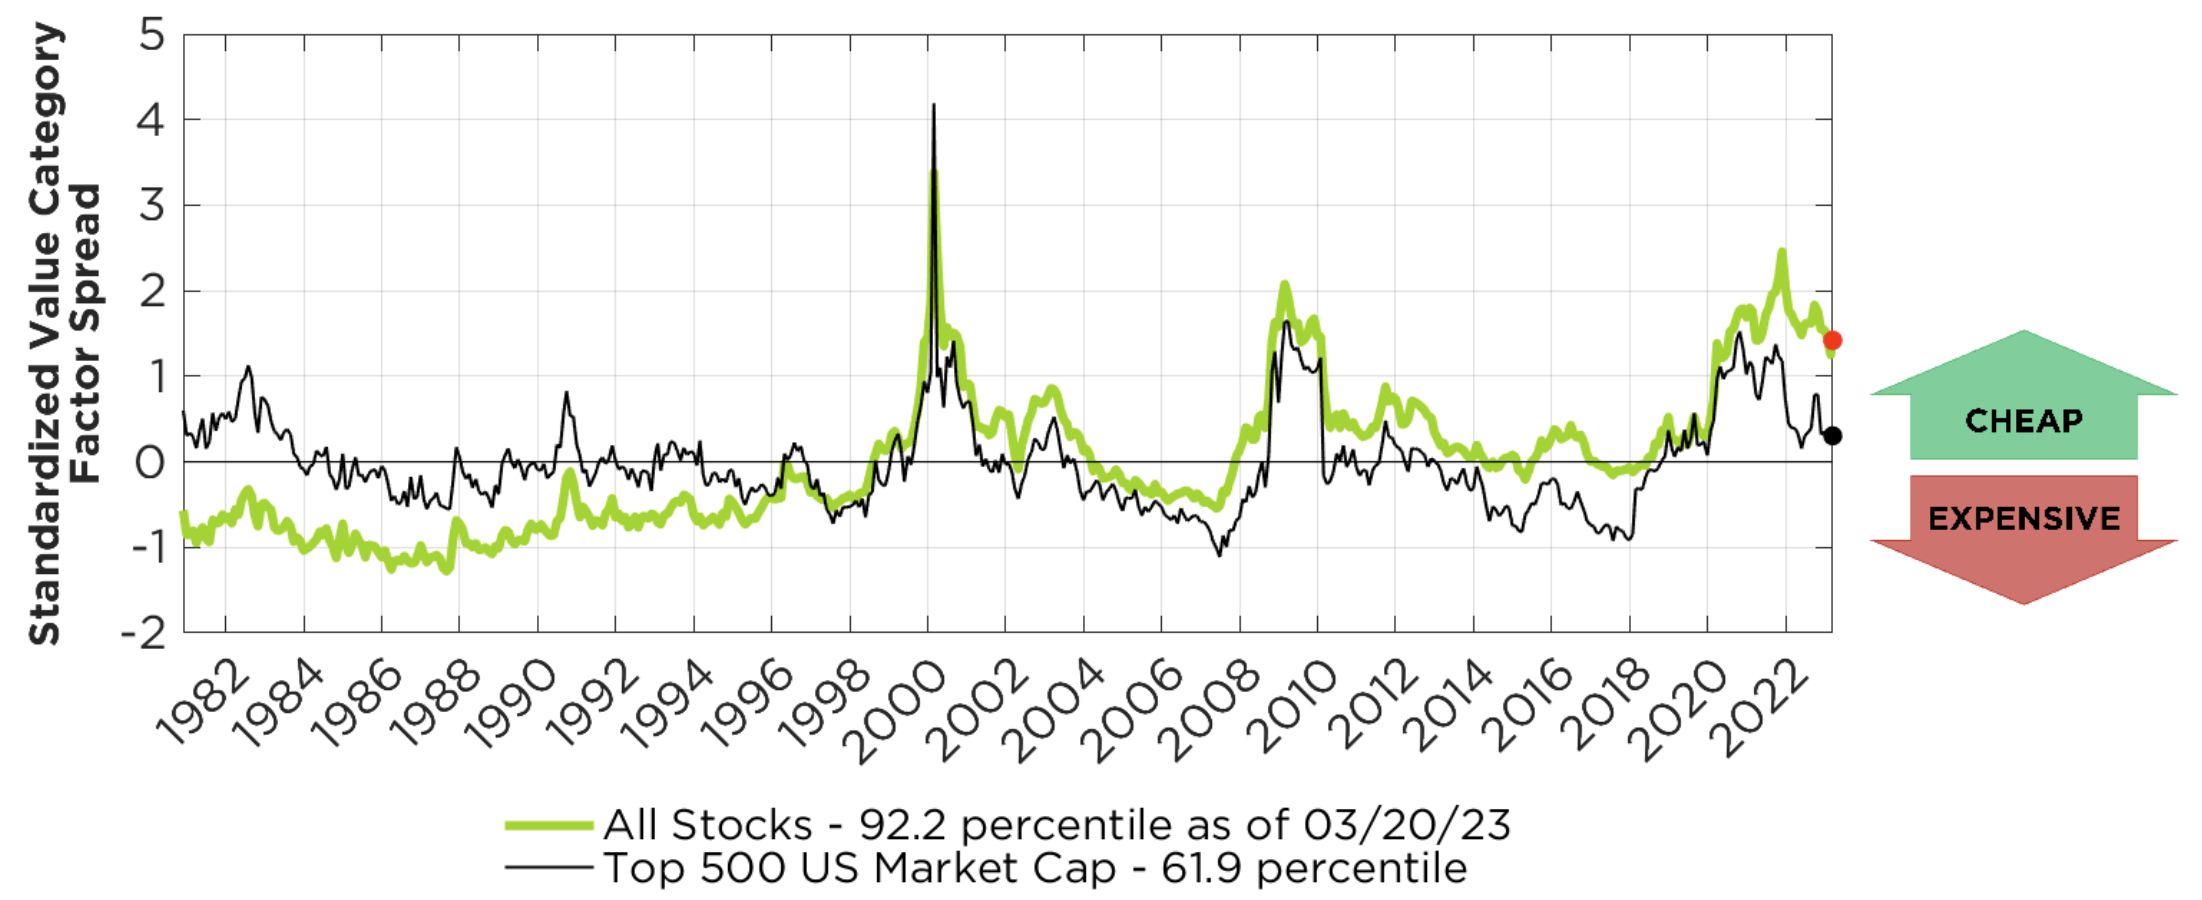
    The indices shown are for informational purposes only and are not reflective of any investment. The “Top 500 US Market Cap” subset is defined as the top 500 stocks sorted by market capitalization that trade in the United States which is evaluated on a point in time monthly basis. It is not possible to invest an index. The data shown does not reflect or compare features of an actual investment, such as its objectives, costs and expenses, liquidity, safety, guarantees or insurance, fluctuation of principal or return, or tax features. Past performance is no guarantee of future results. There is no guarantee that any investment strategy will achieve its objectives, generate profits or avoid losses.

    Factor Spread Methodology

    Valuation factor spreads are computed by using four valuation factors: Earnings to Price, Price to Sales, Price to Book, and Cashflow to Enterprise value. Each factor value is sorted within sector, and the top quintile is used to form the “cheap” basket while the bottom quintile is used to form the “expensive” basket. The median value within each basket is taken for every given month in the history. A ratio of these medians is computed on a monthly basis, and that series of ratios is transformed into a standardized z-score, reflecting the normalized variance from the mean historic value at any point in time.

    Each factor is equal weighted, and the z-score depicted is an average of the z-score of individual factors. The percentile on each chart is derived from the z-score, assuming normality in distribution of historic measures of ratios of medians. A z-score of 0 would derive a percentile of 50% with this approach, meaning the result is at the historical mean.

    Long-only “value of value” is computed identically to the above, except that the absolute value of the median from the top quintile “cheap” basket is not transformed by a ratio against the “expensive” basket referred to above.
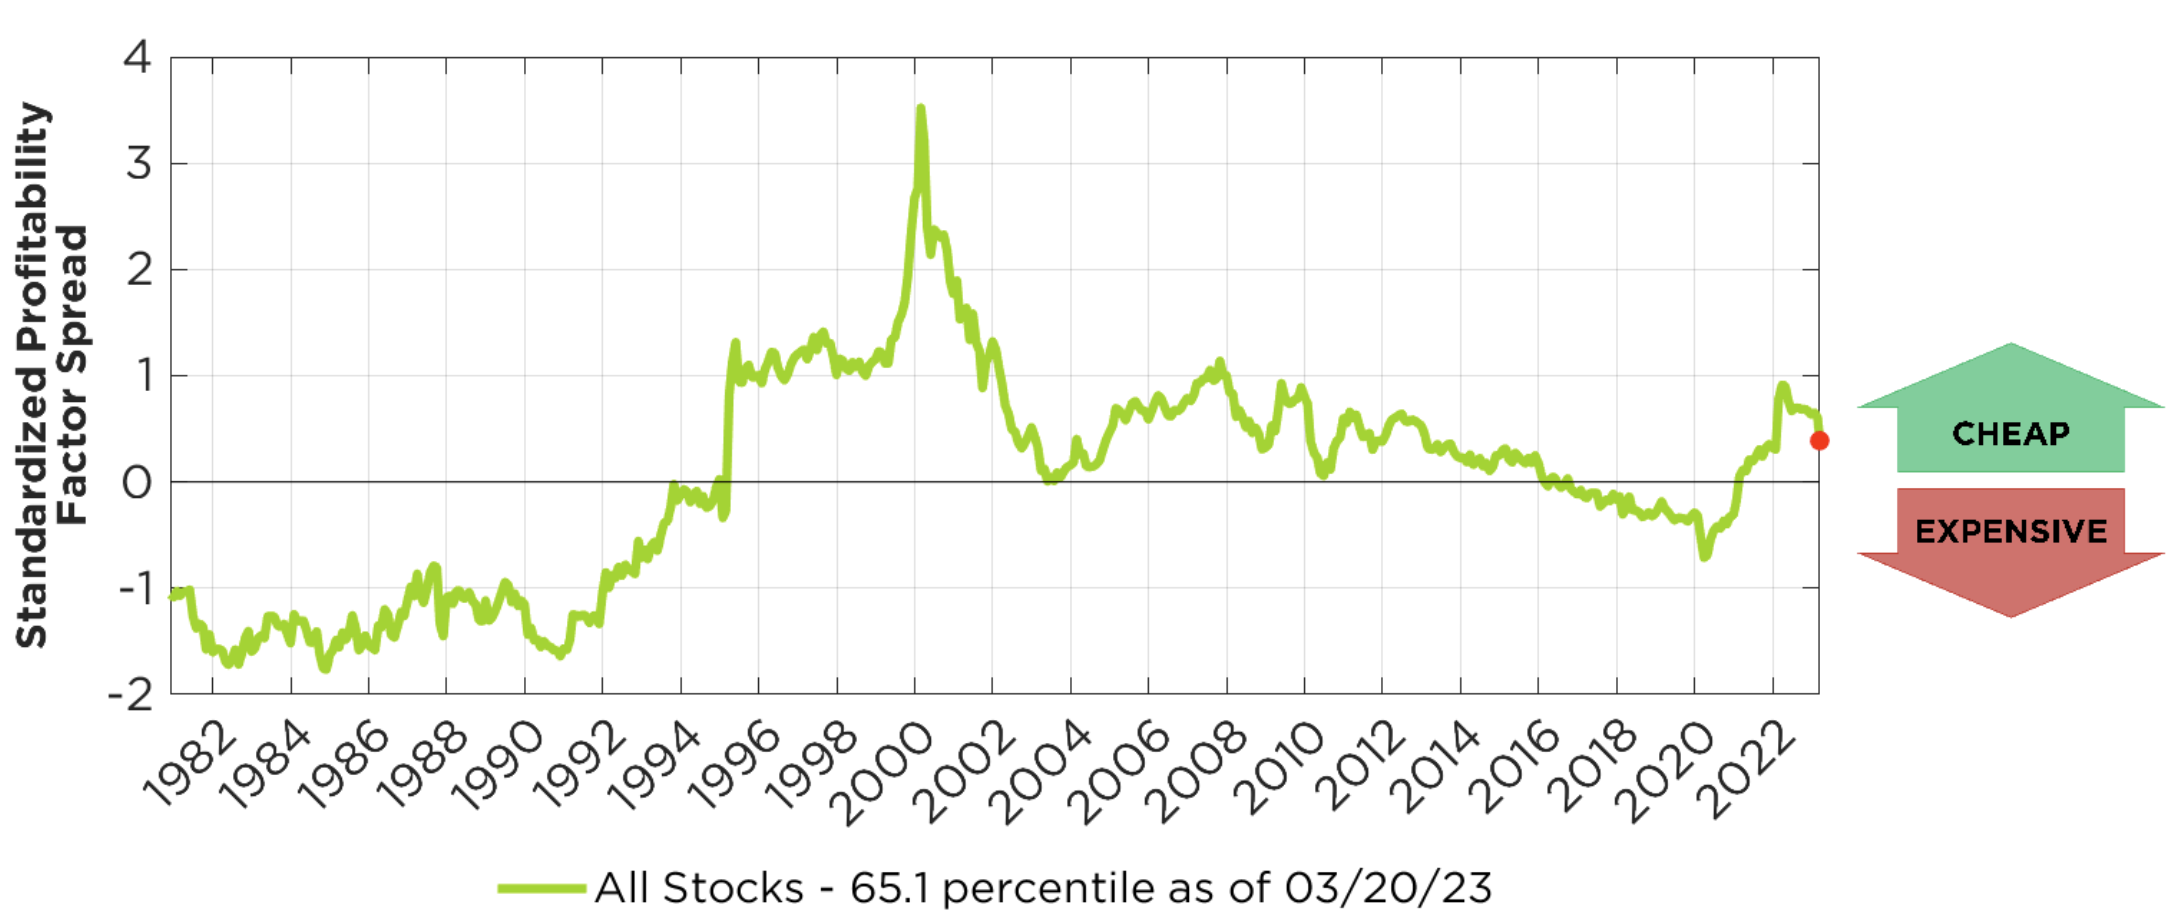
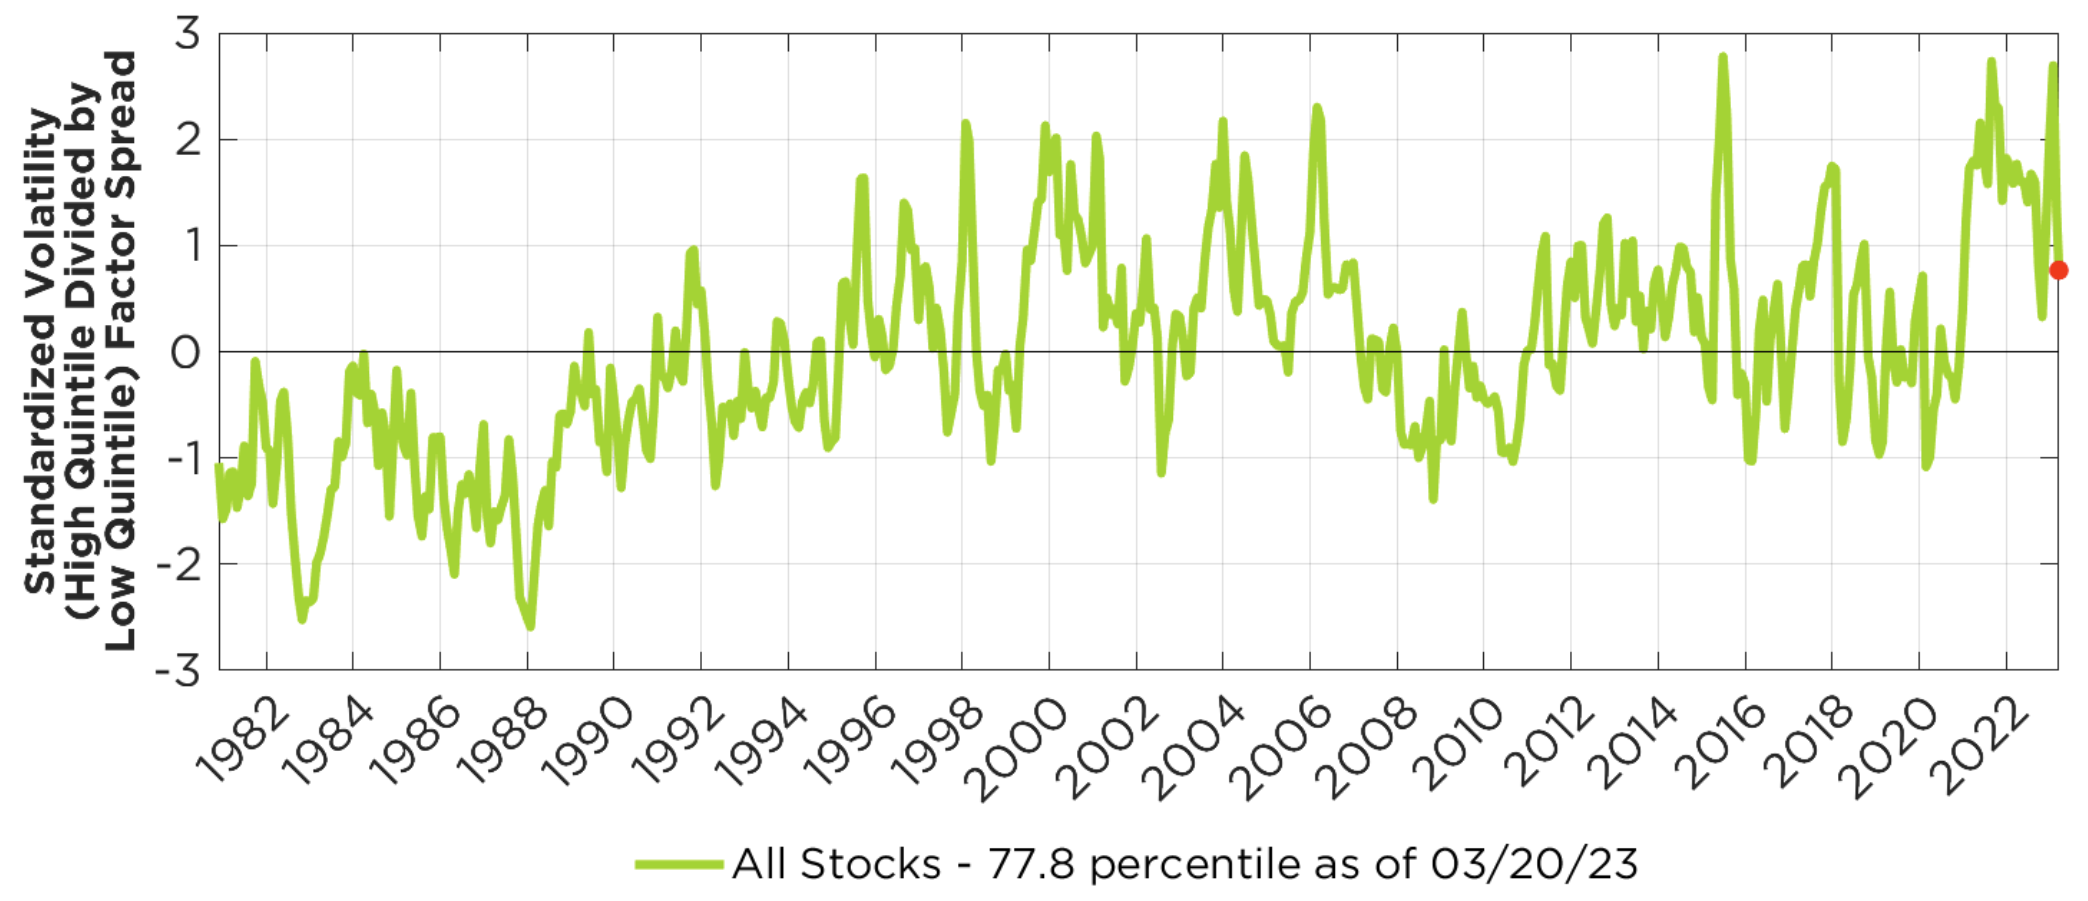
    The profitability factor spread utilizes the ratio of gross profits to average company assets. The volatility factor uses 90-day trailing realized volatility to form its sorts.

    The methodology for computation of factor spreads of these two factors is the same as above, but only differs that value-related factors are not utilized. The profitability factor is sorted, and the ratio of median of the profitability factor for top and bottom quintiles are computed. The volatility factor is sorted and transformed the same way.
    The universe of stocks is represented by global developed, includes no emerging markets, and all valuations imply equal weighting of chosen median values.

    Definitions

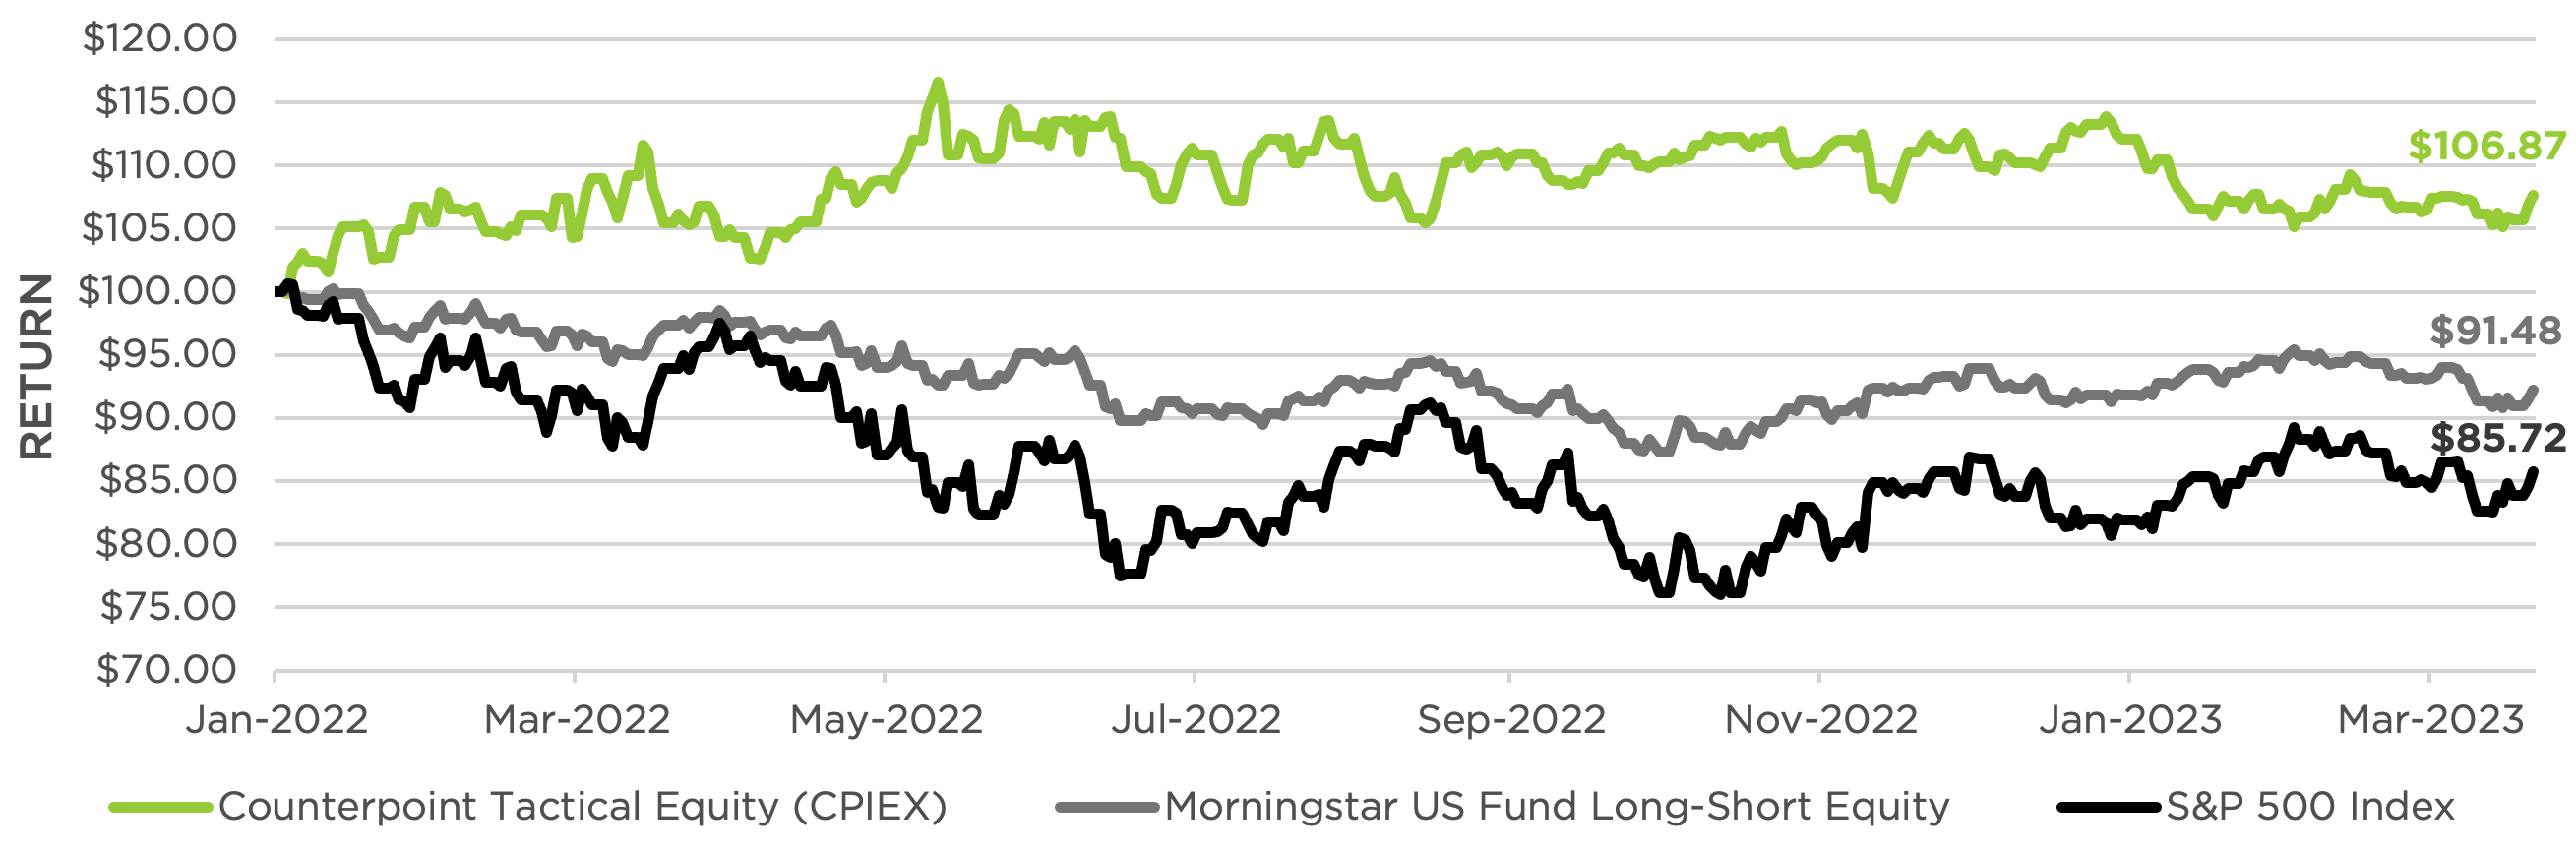
    S&P 500 USD includes 500 leading companies in leading industries of the U.S. economy and is a proxy for the total stock market.

    Return is the percentage change in the value of an investment, and/or cash flows which the investor receives from that investment, such as interest payments, coupons, cash dividends, stock dividends or the payoff from a derivative or structured product, over a specified time period.

    Beta (β) is a measure of the volatility—or systematic risk—of a security or portfolio compared to the market as a whole or index such as the Bloomberg Barclays US Aggregate Bond Index.

    Standard Deviation (Std Dev) measures the dispersion of returns relative to its mean to determine the volatility of an investment and is calculated as the square root of the variance by determining the deviation of daily returns relative to the mean.

    © 2023 Morningstar. All Rights Reserved. The information contained herein: (1) is proprietary to Morningstar and/or its content providers; (2) may not be copied or distributed; and (3) is not warranted to be accurate, complete or timely. Neither Morningstar nor its content providers are responsible for any damages or losses arising from any use of this information. Past performance is no guarantee of future results.

    5282-NLD-03/22/2023


    Recent Perspectives

    Mutual Funds involve risk including the possible loss of principal. Investors should carefully consider the investment objectives, risks, charges and expenses of the funds managed by Counterpoint Funds. This and other important information about the funds is available in their prospectuses, which can be obtained at counterpointfunds.com or by calling 844-273-8637. The prospectuses should be read carefully before investing. The Counterpoint Funds fund family is distributed by Northern Lights Distributors, LLC member FINRA/SIPC. To reach the Counterpoint sales team, please refer to our contact page.

    5516-NLD-09/01/2021


    Thank you!

    We’ve received your request for the featured event collateral. A Counterpoint Funds team member will be in touch shortly.

    Subscribe to stay up to date on and receive our monthly perspective.

    Thank you!

    We’ve received your meeting request and a Counterpoint Funds team member will be in touch shortly.

    Subscribe to stay up to date on and receive our monthly perspective.

    Thank you!

    We’ve received your event registration request and will be in touch shortly.

    Subscribe to stay up to date on Counterpoint Funds and receive our monthly perspective.

    Thank you!

    We have received your application and look forward to reviewing your qualifications for the role. If your application seems like a good fit, we will contact you to discuss next steps.

    Thank you again for your application and interest in joining the Counterpoint team!

    Thank you!

    We’ve received your message. A Counterpoint Funds team member will contact you soon.

    Subscribe to stay up to date and receive our monthly perspective.