Where Tactical Equity Can Fit in a Portfolio


Some investors have shown increased interest in long-short equity strategies amid a down year for stocks and bonds. But proper diligence requires more than a look at a couple years’ recent performance. Investors should consider how a low-correlation strategy like the Counterpoint Tactical Equity Fund (CPIEX) might fit within a total portfolio.

Building a Portfolio with Tactical Equity

Investors can use CPIEX to potentially moderate their overall exposure to stock markets. The table below shows how CPIEX and other asset classes have historically tracked the wider market and can infer a reduction in stock market risk if held since inception.

Stock Market Risk Since 2016 – 01/01/2016 to 09/30/2022


Source: Morningstar. For illustrative purposes only. Beta is a measure of the volatility—or systematic risk—of a security or portfolio compared to the market as a whole

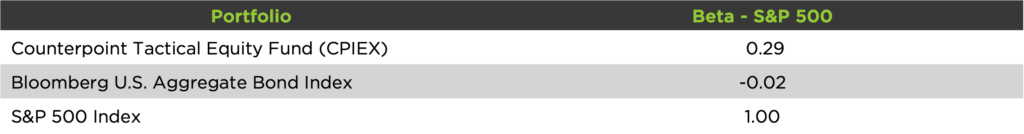
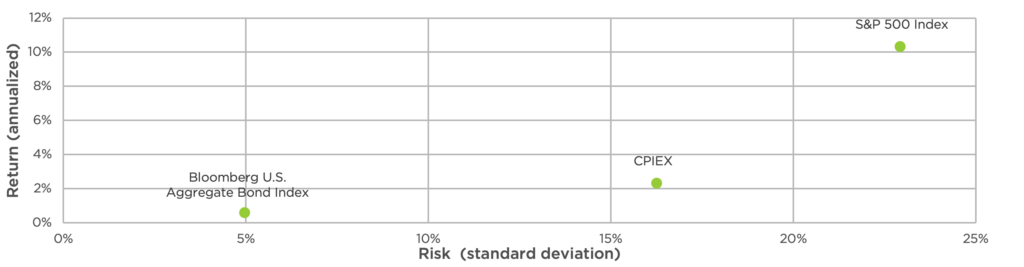
Reallocating from stocks into CPIEX can potentially reduce market beta. As can be inferred via the chart above, reallocating from bonds can increase stock market risk; however, reallocating a portion from both stocks and bonds in equal measure has the potential to hold market beta nearly steady. Let’s not forget the potential benefits of adding diversifier strategies to a portfolio that are uncorrelated to traditional asset classes. The chart below measures risk on the x-axis (riskier is further to the right) and return on the y-axis (more return as you go up). Strategies improve as they go up and to the left. Historically, reallocating equally from stocks and bonds into CPIEX could essentially preserve a portfolio’s risk and reward measurements. Reallocating from stocks may reduce risk, reallocating from bonds can increase risk.

Historical Risk-Reward Since 2016 – 01/01/2016 to 09/30/2022


Source: Morningstar. For illustrative purposes only. There is no guarantee that any investment strategy will achieve its objectives, generate profits or avoid losses. The S&P 500 Index includes 500 leading companies in leading industries of the U.S. economy and is a proxy for the total stock market. The Bloomberg U.S. Aggregate Bond Index is comprised of government securities, mortgage-backed securities, asset-backed securities and corporate securities with maturities of one year or more to simulate the universe of bonds in the market. Investors cannot directly invest in an index and unmanaged index returns do not reflect any fees, expenses or sales charges.

The performance data displayed here represents past performance, which is no guarantee of future results. Current performance may be lower or higher than the performance data quoted. The investment return and principal value of an investment will fluctuate so that investor’s shares, when redeemed, may be worth more or less than their original cost. For performance information current to the most recent month-end, please call toll-free 844-273-8637.


What A Lower Stock Market Risk Looks Like in 2022

To realize the full benefits of many strategies, an investor usually needs to be invested through various market cycles. The following chart illustrates the performance of CPIEX over the last year relative to stocks and bonds:

Growth of $100 – 10/01/2021 to 09/30/2022


Source: Morningstar. For illustrative purposes only. Investors are not able to invest directly in the indices referenced in this illustration. The referenced indices are shown for general market comparisons and are not meant to represent the Portfolio. Each of these asset classes has its own set of investment characteristics and risks and investors should consider these risks carefully prior to making any investments.

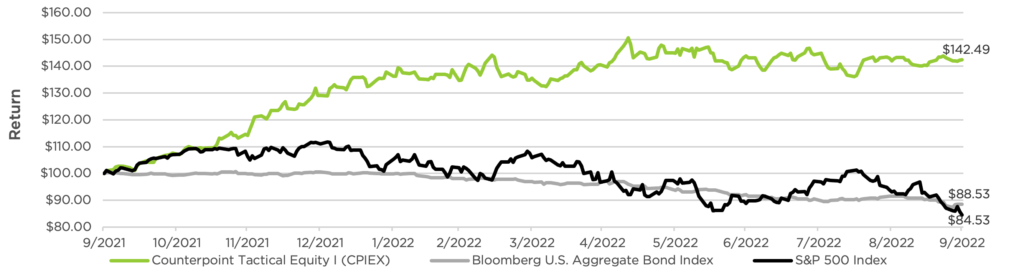
One of the keys to successful use of low-correlation strategies is to understand that they are designed to perform differently – which can mean showing resilience in challenging environments as well as struggling when other asset classes are doing well.

 Conclusion

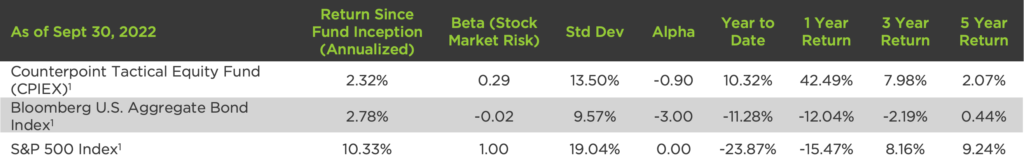
Investors who are interested in the Counterpoint Tactical Equity Fund (CPIEX) need to understand how it fits in an investor portfolio from the perspective of stock market risk. Additionally, position sizing is likely to be a key driver of an investor’s long-run ability to benefit from the strategy’s low-correlation return profile and unique multifactor approach to stock selection.

In a rising-rate environment where stocks and bonds have produced negative year-to-date returns at the same time, alternative strategies that target differentiated return sources. When stocks and bonds move in the same direction, there may be a benefit to finding diversifier strategies that don’t behave like either asset class. That’s one definition of “alpha” – the amount of return an investor can expect after adjusting for the strategy’s stock market risk.


1 Counterpoint Tactical Equity Fund inception date is November 30, 2015. Total Annual Operating Expenses: 1.82%


The performance data displayed here represents past performance, which is no guarantee of future results. Current performance may be lower or higher than the performance data quoted. The investment return and principal value of an investment will fluctuate so that investor’s shares, when redeemed, may be worth more or less than their original cost. The Fund’s maximum sales charge for Class A shares is 5.75%. The Fund’s adviser has contractually agreed to waive its fees and reimburse expenses of the Fund, at least until January 31, 2023 to ensure that Total Annual Fund Operating Expenses After Fee Waiver and Reimbursement but does not include: (i) any front-end or contingent deferred loads; (ii) brokerage fees and commissions, (iii) acquired fund fees and expenses; (iii) borrowing costs (such as interest and dividend expense on securities sold short); (iv) taxes; and (v) extraordinary expenses, such as litigation expenses (which may include indemnification of Fund officers and Trustees, contractual indemnification of Fund service providers (other than the Adviser)) do not exceed 2.00%, 2.75% and 1.75% of average daily net assets attributable to Class A, Class C, and Class I shares, respectively. Without the fee waiver, for 2021 total annual fund operating expenses would be 3.77%, 4.52% and 3.52% for Class A, C and I shares, respectively. For performance information current to the most recent month-end, please call toll-free 844-273-8637.

Investors should carefully consider the investment objectives, risks, charges and expenses of the funds managed by Counterpoint Mutual Funds. This and other important information about the funds are available in their prospectuses, which can be obtained at counterpointfunds.com or by calling 844-273-8637. The prospectuses should be read carefully before investing. The Counterpoint Mutual Funds fund family is distributed by Northern Lights Distributors, LLC member FINRA/SIPC. Counterpoint Mutual Funds, LLC is not affiliated with Northern Lights Distributors, LLC member FINRA/SIPC.


Important Risk Information

Mutual Funds involve risk including the possible loss of principal. The use of leverage by the Fund or an Underlying Fund, such as borrowing money to purchase securities or the use of derivatives, will indirectly cause the Fund to incur additional expenses and magnify the Fund’s gains or losses. Derivative instruments involve risks different from, or possibly greater than, the risks associated with investing directly in securities and other traditional investments. There is a risk that issuers and counterparties will not make payments on securities and other investments held by the Fund, resulting in losses to the Fund. Past performance is no guarantee of future results. There is no assurance the Fund will meet their stated objectives.

Investments cannot be made in an index. Unmanaged index returns do not reflect any fees, expenses or sales charges.  Past performance is no guarantee of future results.  There is no guarantee that any investment will achieve its objectives, generate positive returns, or avoid losses.  The Adviser’s reliance on its strategy and judgments about the attractiveness, value and potential appreciation of particular securities and the tactical allocation among investments may prove to be incorrect and may not produce the desired results. No level of diversification can ensure profits or guarantee against loss.

Index Definitions

S&P 500 USD includes 500 leading companies in leading industries of the U.S. economy and is a proxy for the total stock market. BBgBarc Agg Bond refers to the Bloomberg Barclays Aggregate Bond Index, which is comprised of government securities, mortgage-backed securities, asset-backed securities and corporate securities with maturities of one year or more to simulate the universe of bonds in the market. The Bloomberg US Agg is represented by the Bloomberg Barclays US Treasury 7-10 Year Index, which measures total return of US dollar-denominated, fixed-rate, nominal debt issued by the US Treasury with 7-9.9999 years to maturity.

Definitions

Return is the percentage change in the value of an investment, and/or cash flows which the investor receives from that investment, such as interest payments, coupons, cash dividends, stock dividends or the payoff from a derivative or structured product, over a specified time period

Maximum Drawdown (Max Drawdown) is the maximum observed loss from a peak to a trough of a portfolio, before a new peak is attained and can be used as an indicator of downside risk over a specified time period.

Alpha (α) measures an investment strategy’s ability to beat the market, or “excess return.”

Beta (β) is a measure of the volatility—or systematic risk—of a security or portfolio compared to the market as a whole or index such as the Bloomberg Barclays US Aggregate Bond Index.

Standard Deviation (Std Dev) measures the dispersion of returns relative to its mean to determine the volatility of an investment and is calculated as the square root of the variance by determining the deviation of daily returns relative to the mean.

Morningstar

© 2022 Morningstar. All Rights Reserved. The information contained herein: (1) is proprietary to Morningstar and/or its content providers; (2) may not be copied or distributed; and (3) is not warranted to be accurate, complete or timely. Neither Morningstar nor its content providers are responsible for any damages or losses arising from any use of this information. Past performance is no guarantee of future results.

5962-NLD-11/02/2022

Recent Perspectives

Mutual Funds involve risk including the possible loss of principal. Investors should carefully consider the investment objectives, risks, charges and expenses of the funds managed by Counterpoint Funds. This and other important information about the funds is available in their prospectuses, which can be obtained at counterpointfunds.com or by calling 844-273-8637. The prospectuses should be read carefully before investing. The Counterpoint Funds fund family is distributed by Northern Lights Distributors, LLC member FINRA/SIPC. To reach the Counterpoint sales team, please refer to our contact page.

5516-NLD-09/01/2021


Thank you!

We’ve received your request for the featured event collateral. A Counterpoint Funds team member will be in touch shortly.

Subscribe to stay up to date on and receive our monthly perspective.

Thank you!

We’ve received your meeting request and a Counterpoint Funds team member will be in touch shortly.

Subscribe to stay up to date on and receive our monthly perspective.

Thank you!

We’ve received your event registration request and will be in touch shortly.

Subscribe to stay up to date on Counterpoint Funds and receive our monthly perspective.

Thank you!

We have received your application and look forward to reviewing your qualifications for the role. If your application seems like a good fit, we will contact you to discuss next steps.

Thank you again for your application and interest in joining the Counterpoint team!

Thank you!

We’ve received your message. A Counterpoint Funds team member will contact you soon.

Subscribe to stay up to date and receive our monthly perspective.