The addition of tactical trend following in fixed income can greatly benefit a traditional stock-and-bond portfolio. In How To Shelter from Macro Shocks, we discussed how implementing a tactical strategy with the High Yield Corporate asset class has exhibited a superior risk-reward tradeoff compared to both buy-and-hold strategies and tactical approaches in other asset classes. Naturally this leads to the next question: where does the tactical high yield strategy fit in the portfolio?
For many traditional stock-and-bond portfolios, the answer depends on priorities. If reducing the potential for drawdowns matters most, tactical high yield may be best used as a replacement for stocks. If boosting expected returns is the priority, tactical high yield could be best used as a replacement for bonds. For investors seeking simple strategy diversification, a blended approach replacing both asset classes might be the best fit.
Here are some representative examples of how an allocation to a tactical high yield strategy affects a 60%-40% stock and bond portfolio. In each case, we start from a baseline 60%-40% portfolio, then reallocate 20% of the portfolio to tactical high yield. We use S&P 500 and Bloomberg Barclays Aggregate to represent the equity and fixed income allocations respectively.
The High Yield Strategy is represented by buying the Morningstar High Yield Category when it closes above its 200 day moving average the prior day. The strategy entirely switches to exposure of a 3-5 Year Treasury Index when the high yield index closes below its 200-day moving average. This is a good stylistic example of a “generic” tactical high yield strategy, which we believe sufficiently demonstrates the strategy’s risk characteristics.

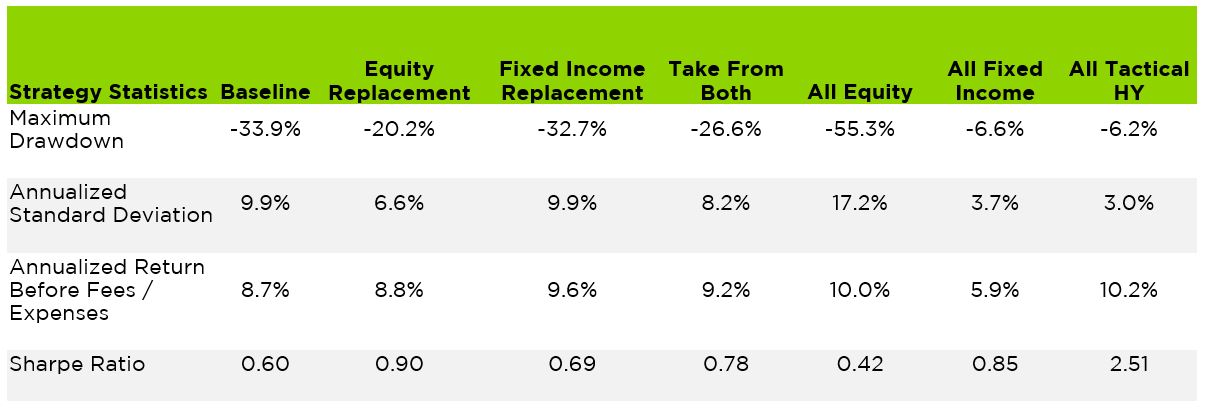
Looking back from 1990 to today, here is how each tactical high yield replacement strategy would have affected the 60%-40% portfolio. One advantage stands out immediately: Each portfolio that includes tactical high yield shows a higher Sharpe ratio, indicating that whatever asset class tactical high yield replaces, risk-adjusted returns tend to improve.

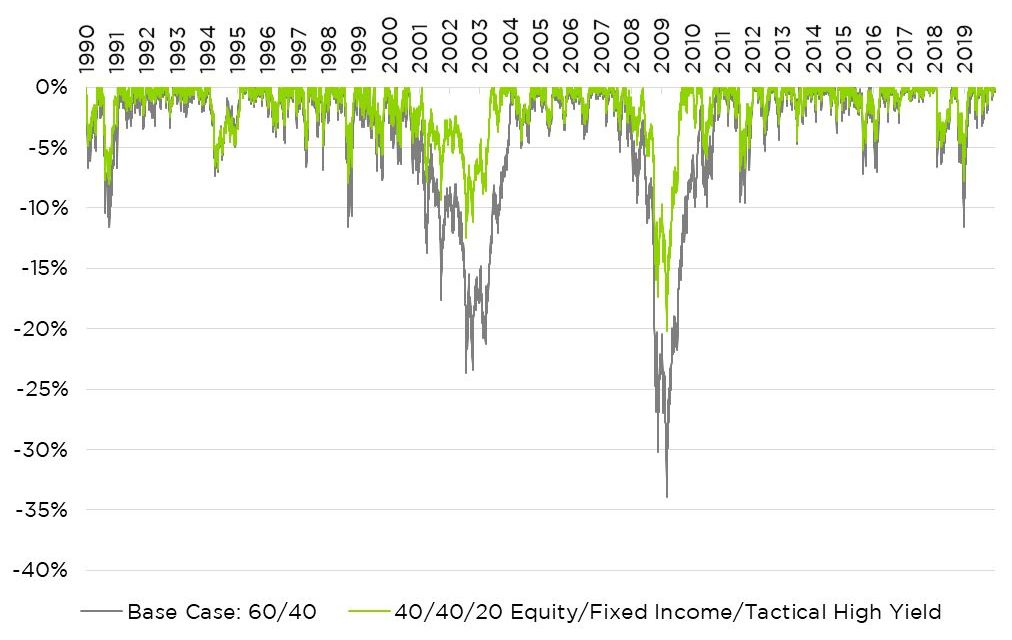
Equity replacement: Taking 20% of the portfolio from the stock allocation and replacing it with a tactical high yield strategy, the most substantial impact comes on the risk side. Max drawdown improves by more than 13 percentage points to around 20% from 34%. That can have a meaningful impact on investors’ emotions. For many people, a 20% drawdown is much easier to endure than a full third of the portfolio value. A reduced standard deviation suggests a tighter range of historical returns. These benefits accrued without reducing expected returns, which were about the same between the baseline and equity replacement portfolios.
The below chart compares drawdown performance for a traditional 60% stock, 40% bond portfolio with a portfolio that reallocates 20% away from stocks and into tactical high yield.
40/40/20 with Tactical High Yield vs. Traditional 60/40 Portfolio – Drawdown

In exchange for improved drawdown performance in tough environments, investors who allocate 20% to tactical high yield give up about 0.6% in expected annual returns. For risk averse investors, the smoother ride might be worth the trade-off.
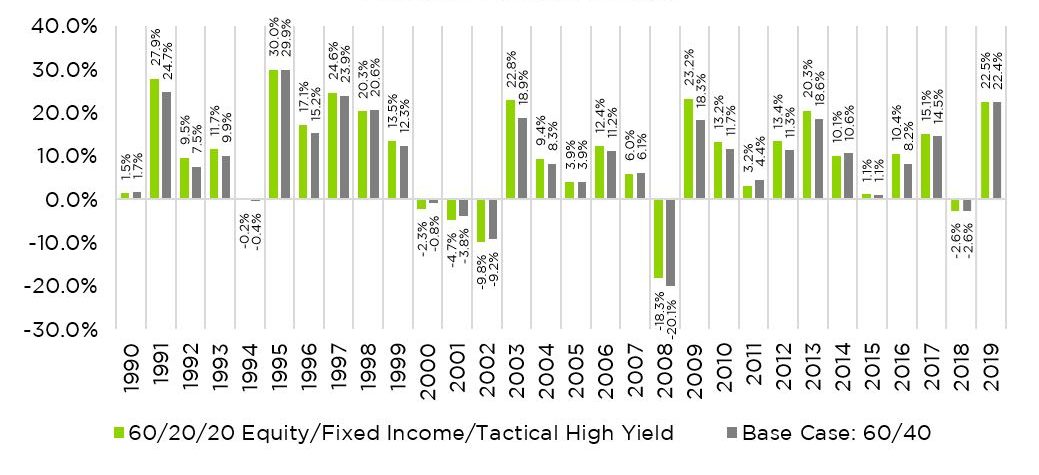
Fixed income replacement: On the other end of the risk spectrum, an investor might take 20% of the portfolio from the bond allocation and replace it with a tactical high yield strategy. Here, the most substantial impact comes on the return side. Annualized return increases by almost a percentage point from the baseline 60%-40% portfolio. Meanwhile, annualized standard deviation holds steady, as does maximum drawdown. You can see the risk-reward impact on a year-to-year basis in the chart below, which shows returns from 1990 to 2019.
60/20/20 with Tactical High Yield vs. Traditional 60/40 Portfolio – Annual Returns

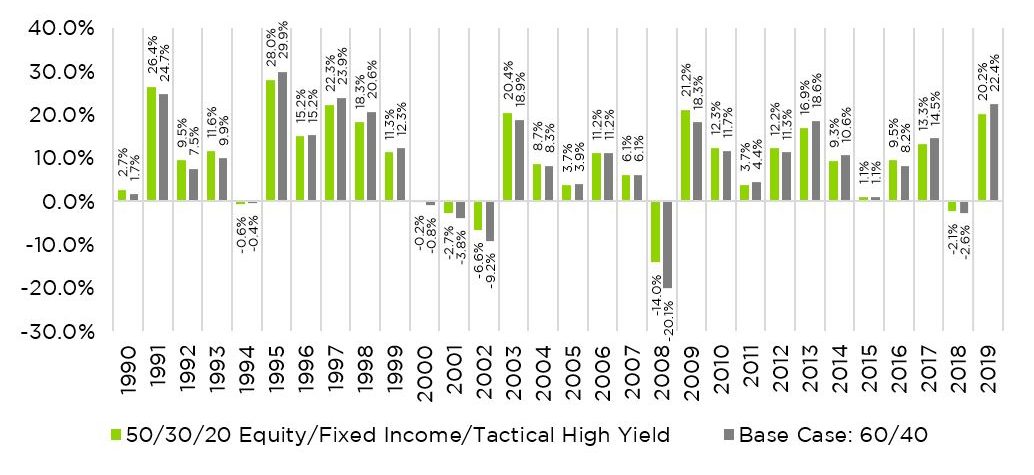
Take from both: Using a blended approach and taking 10% of the portfolio from stocks, 10% from bonds and replacing each with tactical high yield, the portfolio shows improvement on both the risk and return dimensions. Maximum drawdown improved by 7.3 percentage points to 26.6%. Standard deviation also saw some improvement, while annualized returns grew slightly. Here is a comparison of the two portfolios’ annual returns on a year-by-year basis starting in 1990.
50/30/20 with Tactical High Yield vs. Traditional 60/40 Portfolio – Annual Returns

Conclusion
Tactical trend following in high yield credit has historically offered an attractive risk-reward profile. Because it offers reasonable returns while meaningfully reducing maximum drawdowns, this alternative strategy can assist a variety of investors. By allocating to tactical high yield strategies, investors can choose from among three attractive options: a) reduce risk while only modestly sacrificing returns, b) enhance returns without dramatically increasing drawdowns or c) preserve returns while smoothing the drawdown experience. A partial allocation to tactical trend following can thus help investors achieve suitable portfolios with attractive long term risk-reward characteristics.